
Key figures to cite
Each figure states its source and period. Copy the text, or the HTML with a link back to this page.
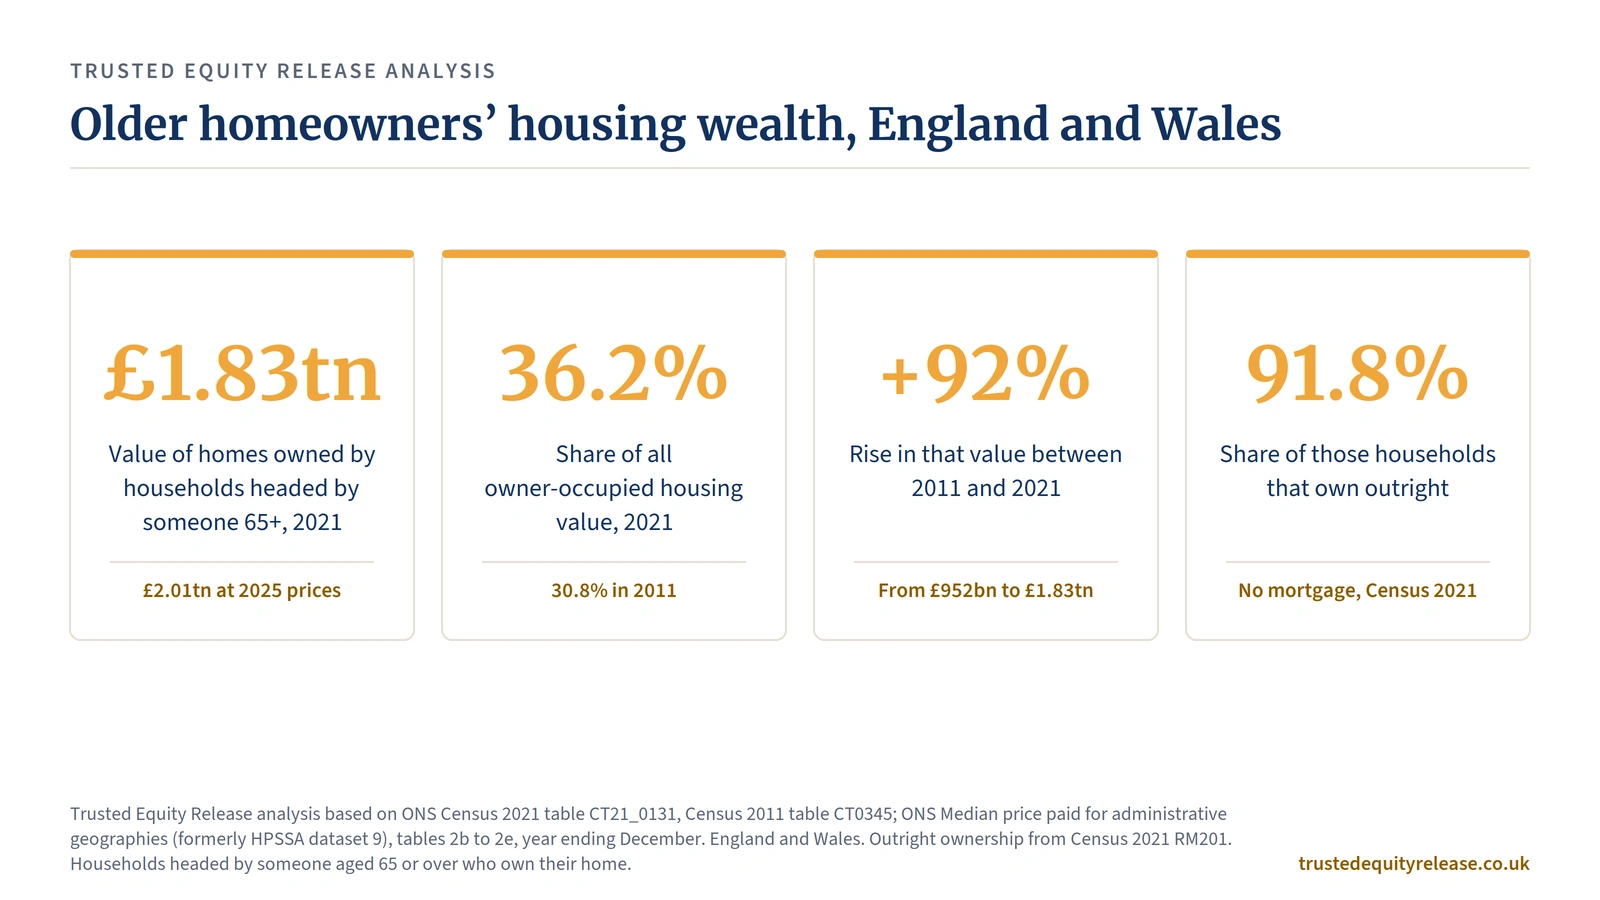
In 2021, households in England and Wales headed by someone aged 65 or over owned homes worth an estimated £1.83tn, valued at local median sale prices (Trusted Equity Release analysis of ONS data).
Those homes made up 36.2% of the value of all owner-occupied homes in England and Wales in 2021, up from 30.8% in 2011.
The value rose from £952bn in 2011 to £1.83tn in 2021. About 69% of the £879bn rise came from higher prices and 31% from more older owner households.
In 2021, 91.8% of homeowner households in England and Wales headed by someone aged 65 or over owned outright, with no mortgage or loan: 5.10m of 5.56m (Census 2021).
At year ending December 2025 prices, the same homes would be worth an estimated £2.01tn, or about £364,000 per household.
In eight local authorities in England, households headed by someone 65+ owned more than half of owner-occupied housing value in 2021, led by North Norfolk at 54.6%. No area was above half in 2011.
London had the highest value per older homeowner household in 2021, at £673,000; the North East had the lowest, at £171,000.
What each statistics page covers
This page is one of a series of four; the hub is UK equity release statistics. All four use the same rules: counted data only, geography and period on every figure, no estimates of what anyone could borrow.
UK equity release statistics
Annual lending 2016 to 2025, who holds Britain's housing wealth, and the Locked-Up Ratio.
02This page£1.83tnof homes owned by over-65s, England and WalesOver-65s housing wealth
The value of homes owned by households headed by someone 65 or over, for every local authority, 2011 to 2025.
03455,778over-65 households still paying a mortgageRetirement mortgage debt
Older households with a mortgage at the 2021 Census, by region, plus the UK interest-only maturity profile.
06£14.7bnof homes passed through taxed estates, 2023 to 2024Inheritance Tax and property
HMRC data on the homes in estates that paid Inheritance Tax, set against equity release lending.
How much housing wealth do older homeowners hold?
Households headed by someone aged 65 or over owned homes worth an estimated £1.83tn in England and Wales in 2021. That covers 5.51 million owner households, an average of £333,000 each. England accounts for £1.76tn across 5.16 million households; Wales for £75.6bn across 342,000 (Trusted Equity Release analysis of ONS data).
The figure values each household's home at the local median sale price for its property type (detached, semi-detached, terraced or flat) in the calendar year of the census. It is a gross value: it does not deduct mortgages, and it covers the home the household lives in, not second homes or other property.
| Area | Owner households, HRP 65+ | Value of homes, 2021 | Per household | Share of owner-occupied value |
|---|---|---|---|---|
| England | 5,164,246 | £1,756.1bn | £340,000 | 36.1% |
| Wales | 342,460 | £75.6bn | £221,000 | 39.6% |
| England and Wales | 5,506,706 | £1.83tn | £333,000 | 36.2% |
Older homeowners hold more than a third of owner-occupied housing value
In 2021, 36.2% of the value of owner-occupied homes in England and Wales sat with households headed by someone aged 65 or over, up from 30.8% in 2011. The rise tracks the growing number of older owners: households headed by someone 65+ made up 35.7% of all owner households in 2021, against 30.2% in 2011 (ONS Census).
Older owners also hold a growing share of larger homes. In 2021, 42.8% of owner-occupied detached houses in England and Wales were owned by households headed by someone aged 65 or over, up from 35.8% in 2011 (ONS Census CT21_0131 and CT0345). Detached houses made up 39.5% of the homes these households owned.
Which regions hold the most older homeowner housing wealth?
The South East holds the most, at an estimated £407bn in 2021, followed by London at £304bn and the East of England at £242bn. Together those three regions account for more than half of the England and Wales total. The North East holds the least, at £44bn.
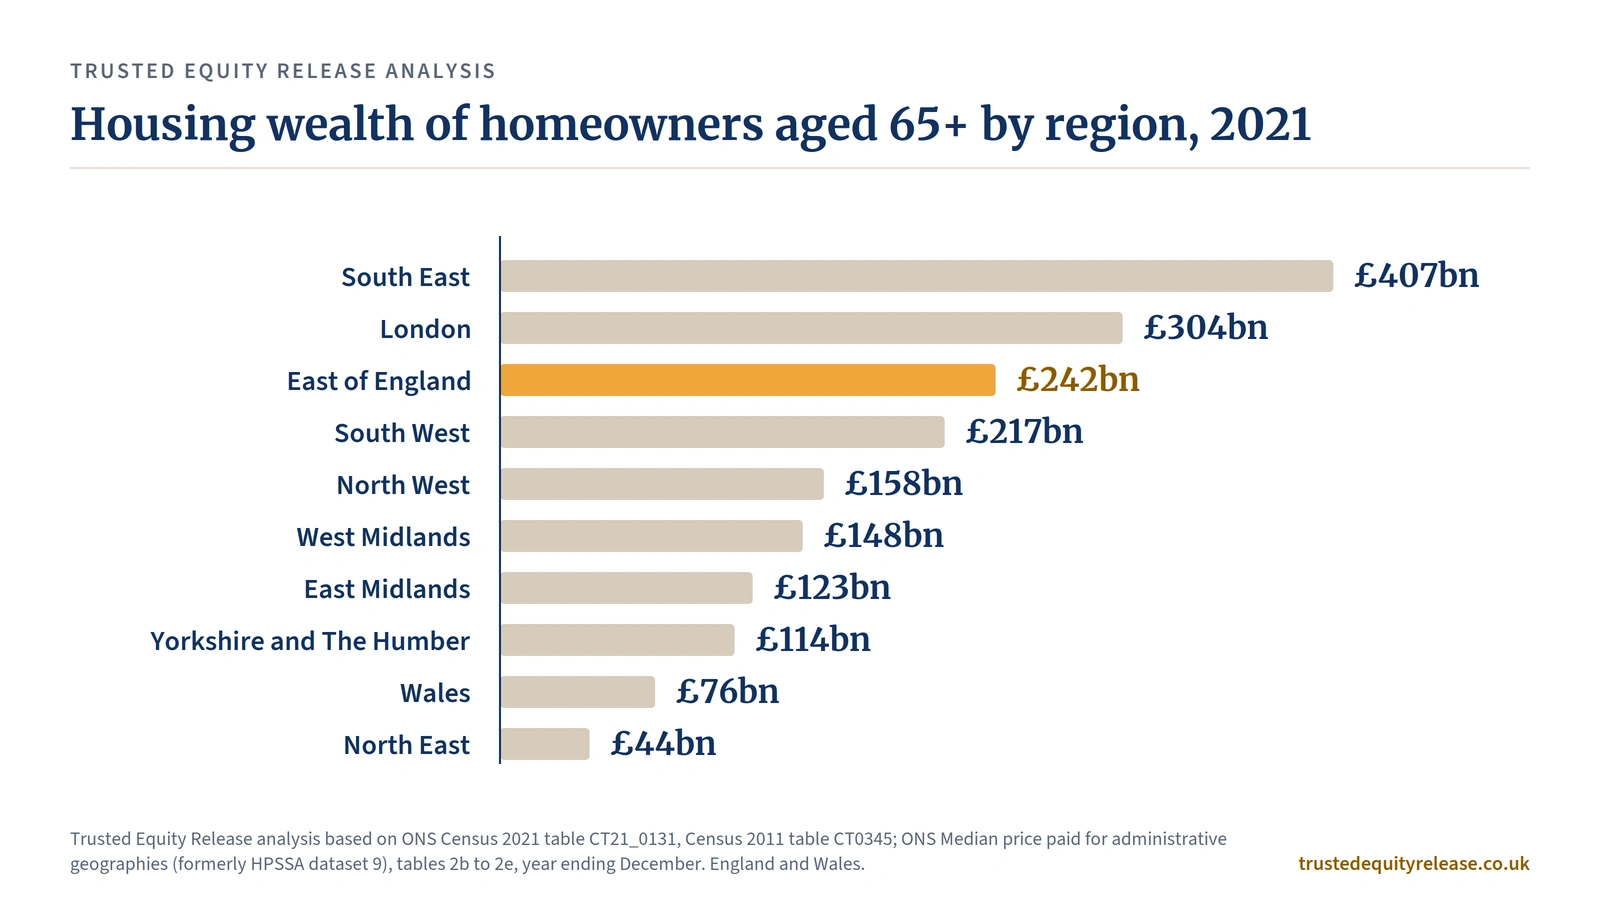
Per household the order changes. London's older homeowners hold the most per home, but the South West has the highest share of owner-occupied value held by over-65s, and London the lowest, because younger owners dominate the capital's market.
| Region | Per household, 2021 | Share of owner-occupied value | Rise, 2011 to 2021 | Own outright |
|---|---|---|---|---|
| London | £673,000 | 29.8% | +102% | 88.0% |
| South East | £439,000 | 37.6% | +95% | 91.2% |
| East of England | £383,000 | 37.1% | +106% | 92.2% |
| South West | £331,000 | 41.6% | +88% | 91.8% |
| West Midlands | £264,000 | 37.6% | +86% | 92.7% |
| East Midlands | £257,000 | 37.1% | +104% | 92.9% |
| North West | £227,000 | 36.1% | +79% | 92.0% |
| Yorkshire and The Humber | £224,000 | 36.4% | +81% | 92.7% |
| Wales | £221,000 | 39.6% | +75% | 92.7% |
| North East | £171,000 | 36.0% | +66% | 92.1% |
Where do over-65s own more than half of the housing value?
In eight local authorities, households headed by someone aged 65 or over owned more than half of owner-occupied housing value in 2021. In 2011, none did. North Norfolk leads at 54.6%, followed by Rother at 52.9% and the Isle of Wight at 50.9%. All eight are coastal or rural areas in the South, South West, East and East Midlands.
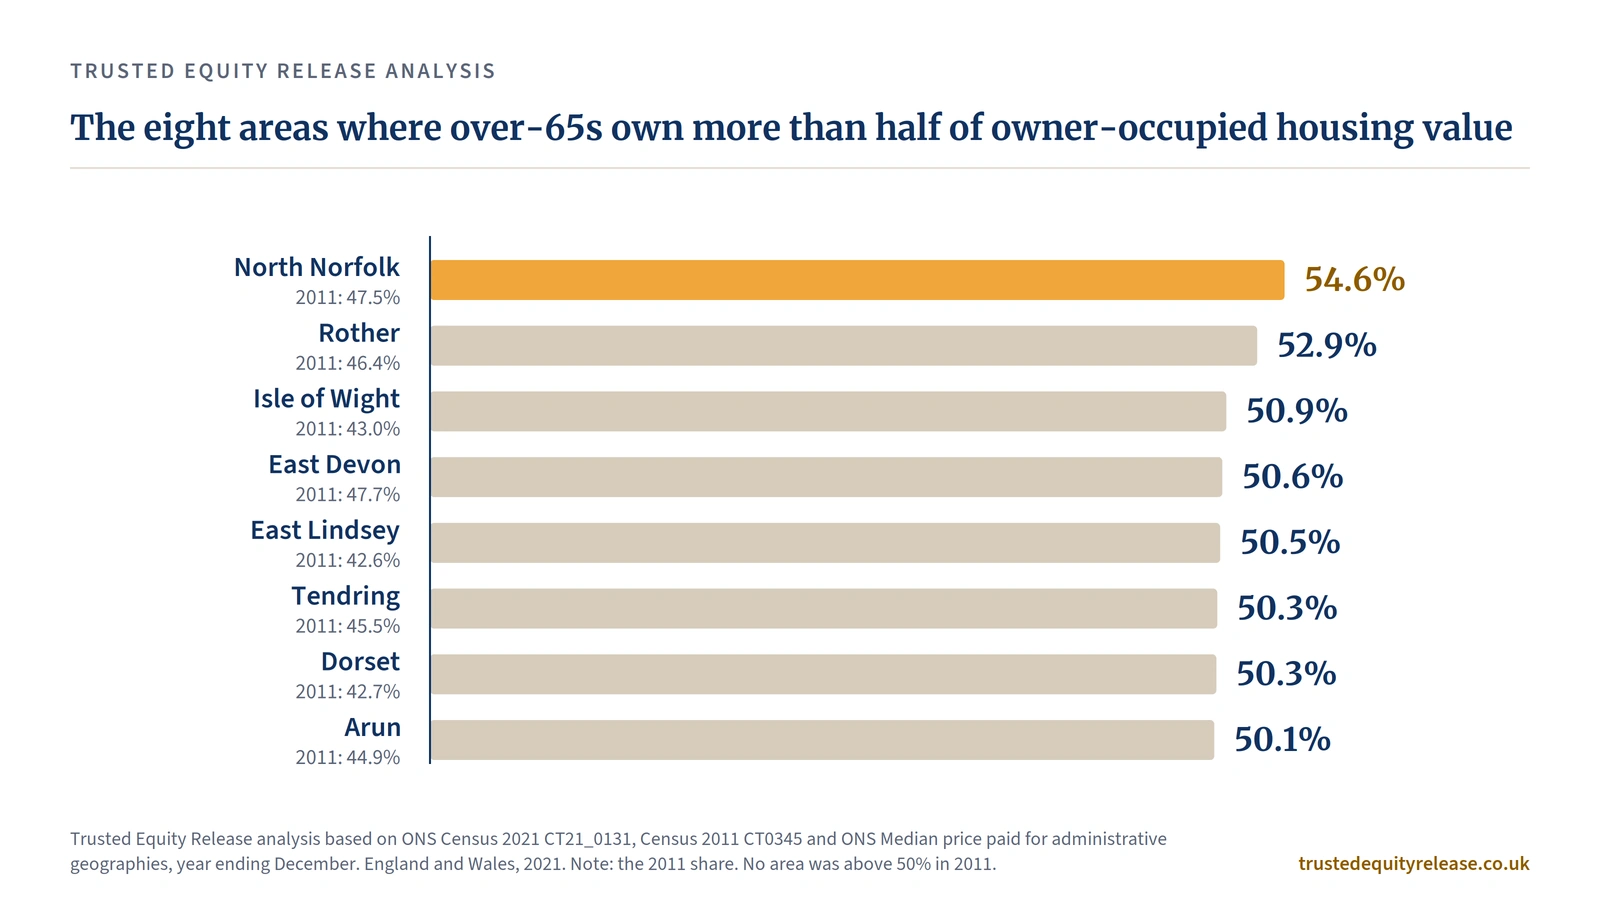
At the other end, the share is lowest in inner London: 12.4% in Tower Hamlets, and under 21% in Southwark, Hackney, Lambeth and Newham. Those boroughs have few older owners and large numbers of younger buyers.
The highest and lowest values per household
The average older homeowner household in Kensington and Chelsea held a home worth an estimated £2.09m in 2021, about 16 times the £131,000 in Blaenau Gwent. Every one of the ten highest values per household is in London or Elmbridge in Surrey; the lowest are in Blaenau Gwent, Hull and Lancashire.
| Highest | Per household, 2021 | Lowest | Per household, 2021 |
|---|---|---|---|
| Kensington and Chelsea | £2,089,000 | Blaenau Gwent | £131,000 |
| City of London and Westminster | £1,360,000 | Kingston upon Hull, City of | £138,000 |
| Camden | £1,183,000 | Blackpool | £142,000 |
| Hammersmith and Fulham | £1,053,000 | Burnley | £143,000 |
| Islington | £972,000 | Hyndburn | £144,000 |
By total value rather than per household, Buckinghamshire comes first at £28.3bn across 53,600 older owner households, ahead of Cornwall and the Isles of Scilly (£22.8bn), North Yorkshire (£22.5bn), Somerset (£22.3bn) and Dorset (£21.9bn). The full ranking for all 316 areas is in the downloadable data.
Price growth, not more homeowners, drove most of the rise
Of the £879bn rise between 2011 and 2021, about £606bn (69%) came from higher prices and £274bn (31%) from more older owner households. The number of owner households headed by someone 65+ grew from 4.52 million to 5.51 million, a 22% increase.
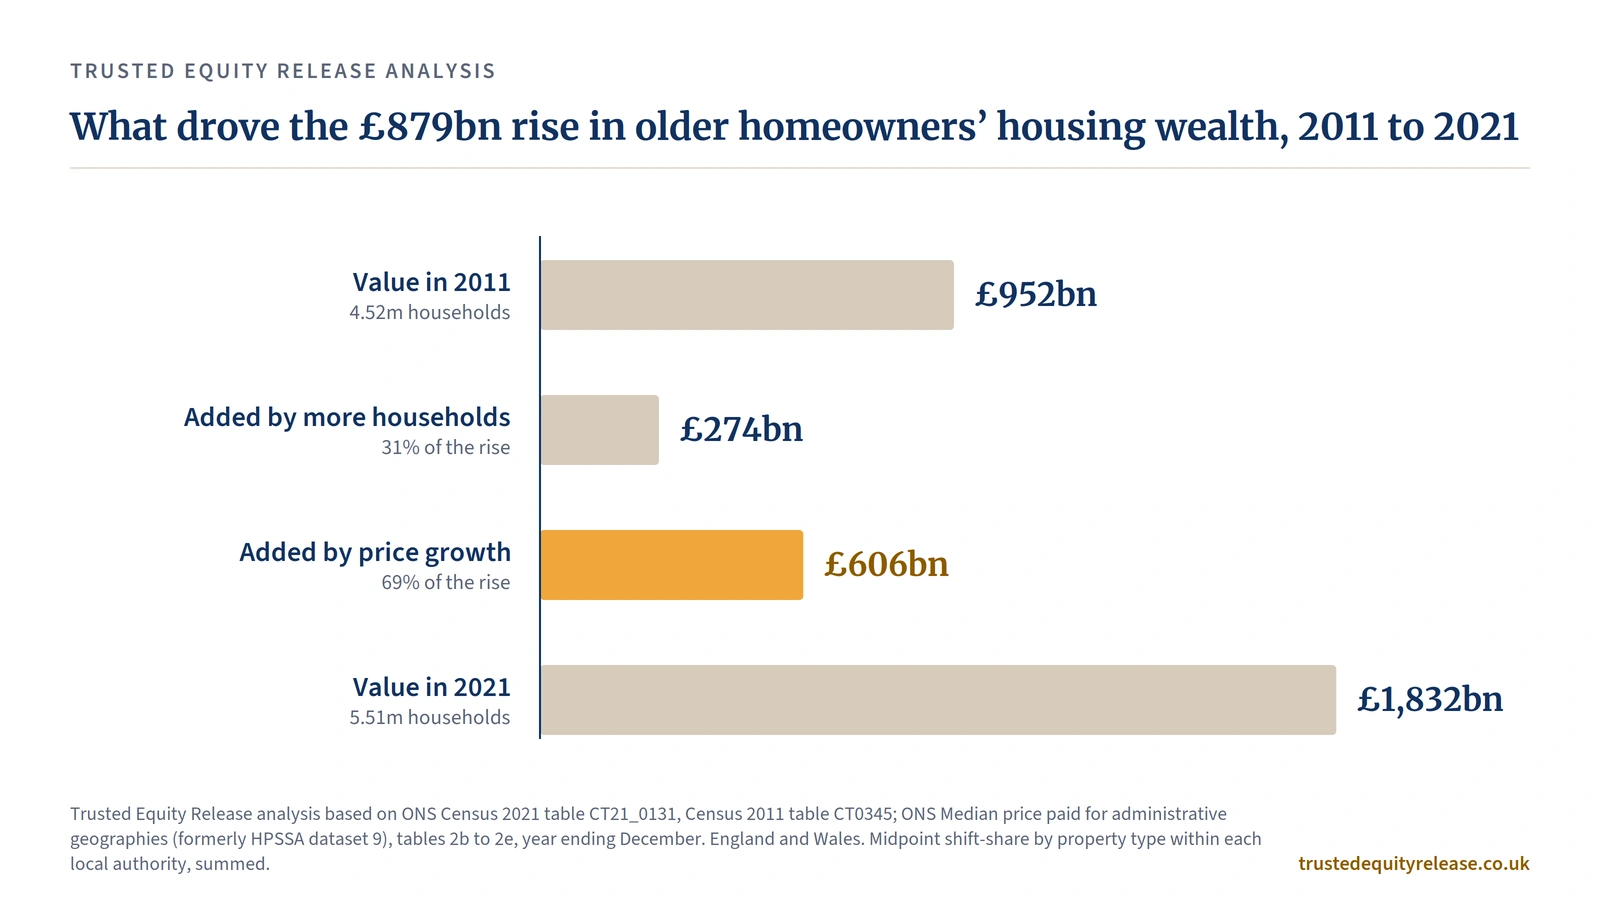
Prices have kept moving since the census. Applying year ending December 2025 median prices to the 2021 household counts gives an estimated £2.01tn, about £364,000 per household. Only three areas come out lower at 2025 prices than in 2021, all in central London: Kensington and Chelsea (from £14.6bn to £12.6bn), City of London and Westminster, and Tower Hamlets. This update reflects prices only; the number of older owners will not be re-counted until the 2031 Census.
How many older homeowners own their home outright?
In 2021, 91.8% of homeowner households in England and Wales headed by someone aged 65 or over owned outright, with no mortgage or loan. That is 5.10 million of 5.56 million households. The other 455,778 owned with a mortgage or loan, or through shared ownership (ONS Census 2021, table RM201).
Outright ownership is lowest in inner London, where 78.6% of older owners in Tower Hamlets own outright, and 88.0% across London as a whole. It is highest in parts of Wales and the Midlands, at around 94% to 95%. Applying each area's outright share to its value gives an estimated £1.67tn in homes owned outright by households headed by someone 65+, on the assumption that mortgaged and outright homes in an area are worth the same.
Cambridgeshire and Peterborough
In Fenland, households headed by someone aged 65 or over held 41.9% of owner-occupied housing value in 2021, the highest share in Cambridgeshire and Peterborough and above the England and Wales figure of 36.2%. Fenland ranks 62nd of 316 areas on this measure. Its older homeowners held homes worth an estimated £2.90bn in 2021, more than double the £1.39bn in 2011, and £3.15bn at 2025 prices.
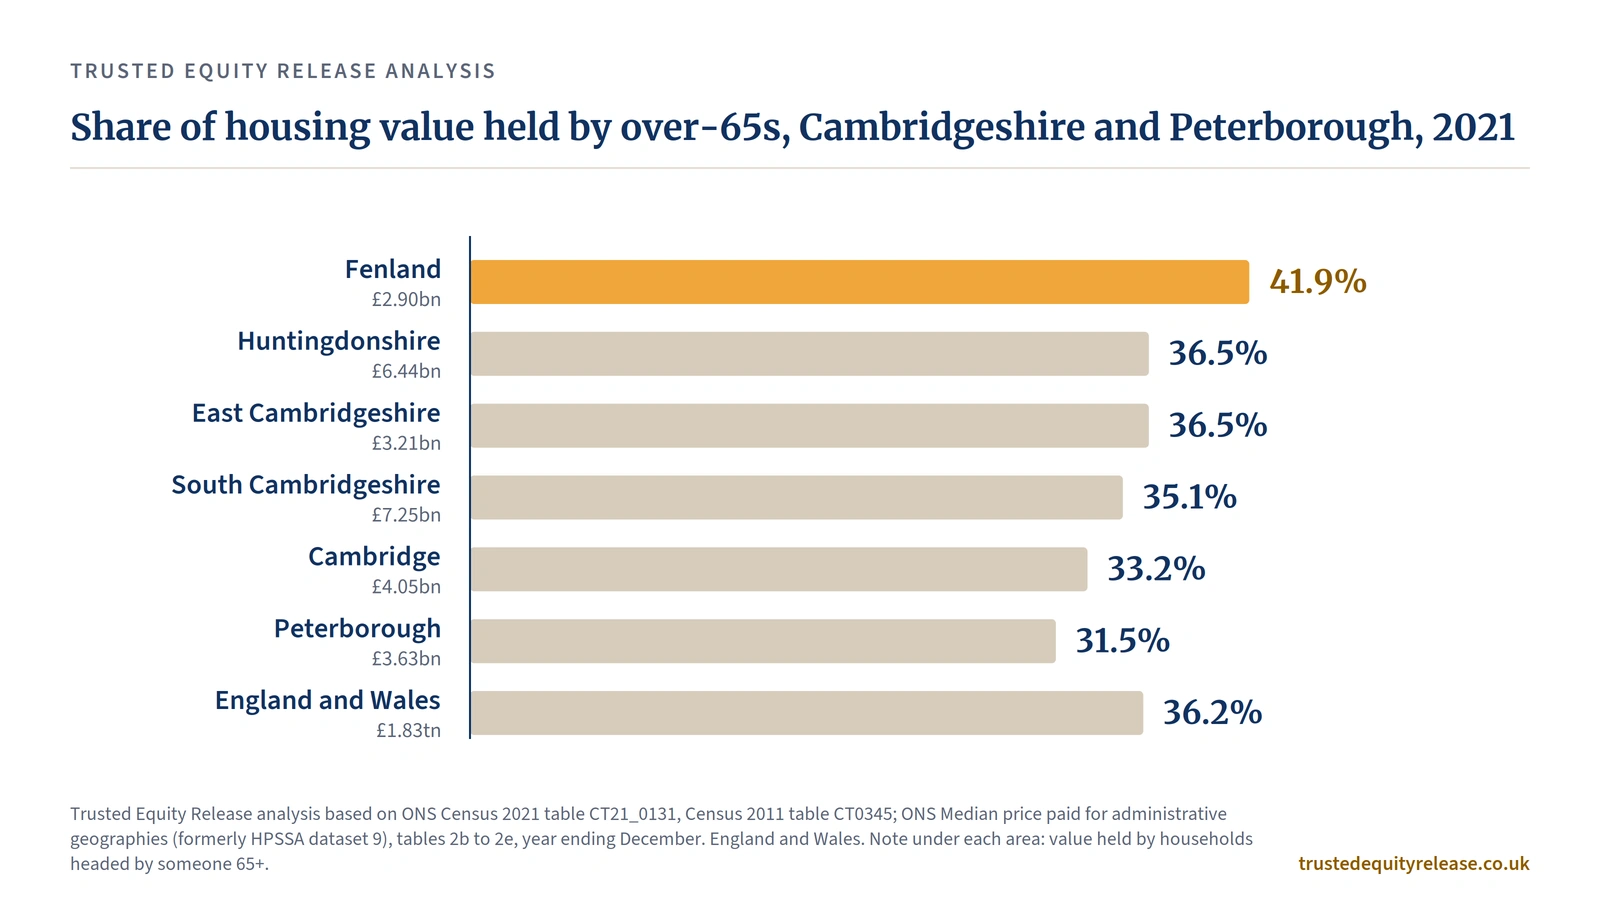
Fenland's value per older owner household, at £245,000, is below the England and Wales average of £333,000, so the high share reflects how many of the district's owners are over 65 rather than higher prices. South Cambridgeshire holds the largest total in the county, at £7.25bn.
The Older Homeowner Wealth Map: how it was built
No official source publishes the value of homes owned by older households for every local authority, so we built it from two ONS sources that are never combined. The census counts older owners by property type in each area; the ONS publishes the median price of each property type in each area. Multiplying one by the other gives a housing wealth figure for every local authority.
How the Older Homeowner Wealth Map is built
Sources. ONS Census 2021 table CT21_0131 and Census 2011 table CT0345: households by age of household reference person, tenure and accommodation type, by merged local authority. ONS Census 2021 RM201 (Nomis NM_2301_1): tenure by age of household reference person. ONS Median price paid for administrative geographies (formerly HPSSA dataset 9), year ending March 2026 edition, tables 2b to 2e: median price paid for detached, semi-detached, terraced and flats, by local authority, year ending December 2011, 2021 and 2025.
Calculation. 1. Count owner households with a household reference person aged 65 to 74, 75 to 84 or 85 and over, by property type, in each area. 2. Multiply each count by the area's median price for that property type in the census year. 3. Sum across property types, then across areas. 4. Repeat for all owner households to give the share. 5. Split the 2011 to 2021 change into household and price effects with a midpoint shift-share. 6. Apply the RM201 outright share in each area for the outright figure.
Assumptions. Median sale prices of homes that sold stand in for the value of homes that did not. Medians understate totals: using ONS mean prices (HPSSA dataset 12, last published 2023) raises the 2021 total by about 12.5%, so £1.83tn is the conservative end of the range. Areas are merged to 316 consistent units so 2011 and 2021 compare like for like. Where an area had no sales of a type, the regional median of local medians is used (Tower Hamlets detached houses only).
Coverage. England and Wales. Owner households include those owning outright, with a mortgage or loan, and shared ownership. Excludes caravans and other mobile or temporary structures, which removes 43,000 older owner households (0.8%), mostly park homes in coastal areas. Gross values: mortgages are not deducted.
Validation. The ONS Wealth and Assets Survey put net property wealth of households headed by someone 65+ in Great Britain at £2.30tn in April 2020 to March 2022 (ONS ad hoc 2813, Table 1). Our £1.83tn is 80% of that (about 90% on mean prices). It should be lower: the survey adds Scotland and second homes and other property, and uses owners' own valuations. Note that the survey's accreditation has been suspended from this round onwards.
Reuse. Free to reuse with a link to this page. The data behind every figure is in the downloads below.
Source key
| Source | Used for | Link |
|---|---|---|
| ONS, Census 2021 table CT21_0131 (ad hoc 1427), 21 March 2021 | Older owner households by property type, 2021 | ons.gov.uk |
| ONS, Census 2011 table CT0345 (ad hoc 003476), 27 March 2011 | Older owner households by property type, 2011 | ons.gov.uk |
| ONS, Census 2021 RM201, Tenure by age, Household Reference Persons (Nomis) | Outright owners aged 65+ | nomisweb.co.uk |
| ONS, Median price paid for administrative geographies (formerly HPSSA dataset 9), year ending March 2026 edition | Median prices by property type, 2011, 2021, 2025 | ons.gov.uk |
| ONS, Mean price paid for administrative geographies (HPSSA dataset 12) | Mean price sensitivity | ons.gov.uk |
| ONS, Household total wealth in Great Britain: April 2020 to March 2022 | Wealth and Assets Survey validation | ons.gov.uk |
Cite this data
Every figure on this page is free to quote with a link back. Jeremy is available for comment on the numbers: jeremy@trustedequityrelease.co.uk.
Trusted Equity Release (2026). Older Homeowner Housing Wealth Statistics 2026: England and Wales. https://www.trustedequityrelease.co.uk/guides/older-homeowner-housing-wealth/
<a href="https://www.trustedequityrelease.co.uk/guides/older-homeowner-housing-wealth/">Older Homeowner Housing Wealth Statistics 2026: England and Wales</a>, Trusted Equity Release, 2026
Trusted Equity Release (2026) Older Homeowner Housing Wealth Statistics 2026: England and Wales. Trusted Equity Release analysis based on ONS Census and ONS house price data. Available at: https://www.trustedequityrelease.co.uk/guides/older-homeowner-housing-wealth/ (Accessed: [date]).
Questions people ask about these figures
How much housing wealth do over-65s have in the UK?
How many over-65s own their home outright?
How many households aged 65 and over own their home?
What share of housing wealth do older people hold?
Where do older homeowners hold the most housing wealth?
How fast has older homeowner housing wealth grown?
Why do these figures cover England and Wales only?
How is this different from the Wealth and Assets Survey?

Trusted Equity Release is a trading name of Pellucid Ltd, authorised and regulated by the Financial Conduct Authority, FRN 981845. About Jeremy.