
Key figures to cite
Each figure states its source and period. Copy the text, or the HTML with a link back to this page.
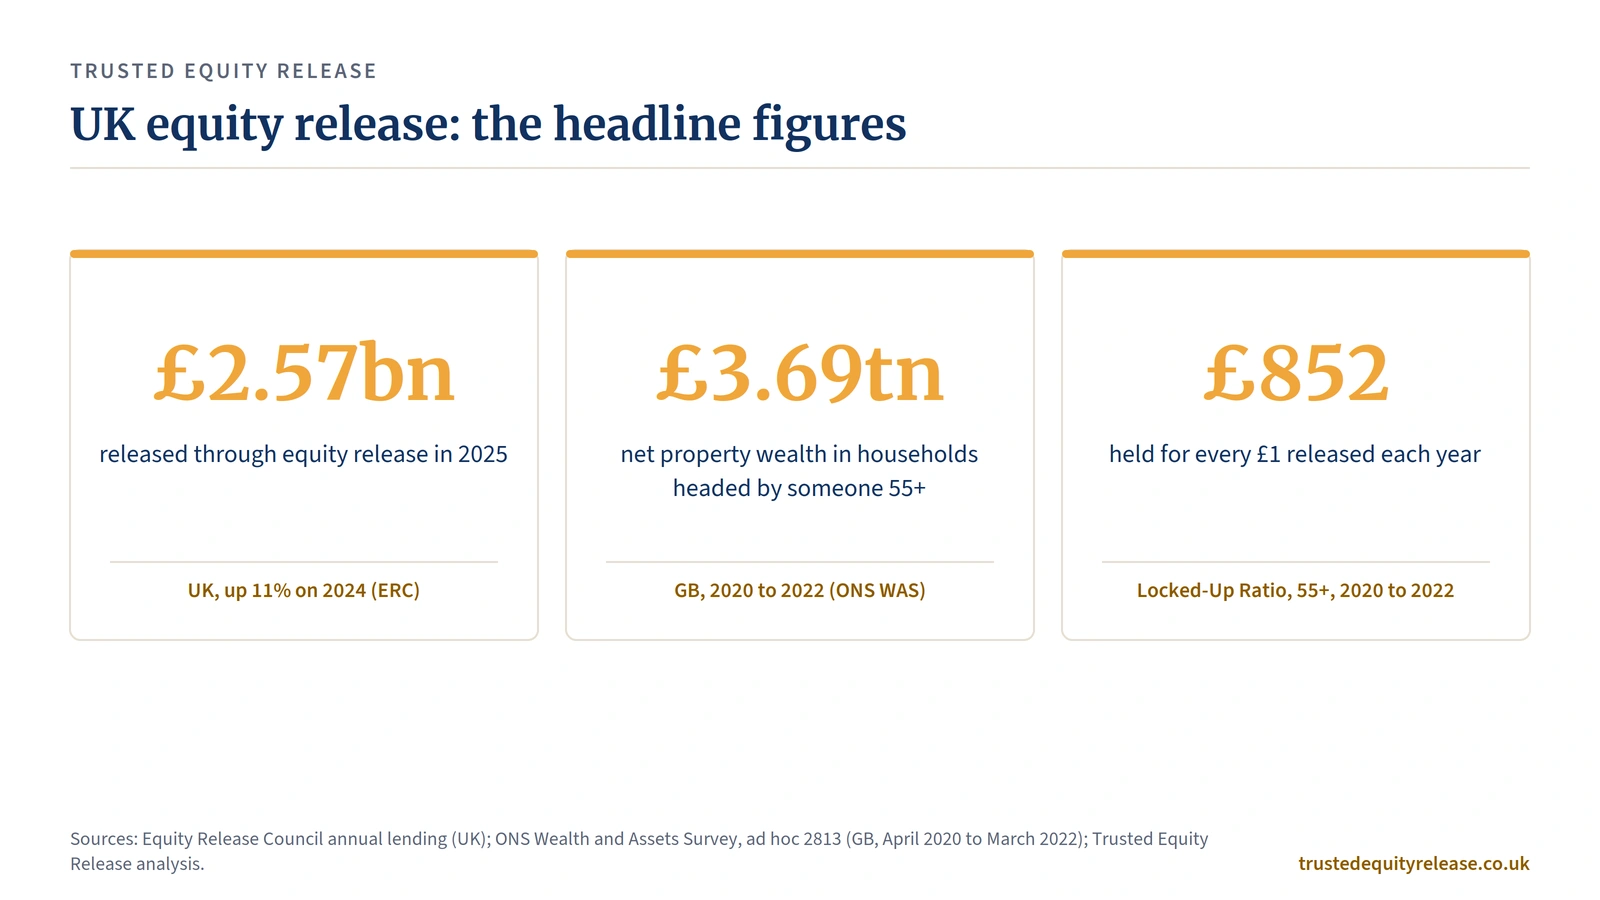
In 2025, UK equity release lending totalled £2.57bn, up 11 per cent from £2.3bn in 2024 (ERC).
UK equity release lending reached a record £6.2bn in 2022, then fell 58 per cent to £2.61bn in 2023 (ERC).
Households in Great Britain headed by someone aged 55 or over held £3.69 trillion of net property wealth between April 2020 and March 2022, 68 per cent of the total (ONS Wealth and Assets Survey).
For every £1 released through equity release each year, households in Great Britain headed by someone aged 55+ held £852 of net property wealth in 2020 to 2022, down from £1,253 in 2016 to 2018 (Trusted Equity Release analysis of ONS and ERC data).
FCA Product Sales Data record around 27,000 lifetime mortgages worth £2.16bn advanced in the UK in 2025 (FCA).
The median age of UK lifetime and retirement interest-only mortgage borrowers was around 71 between 2022 and 2025 (FCA Product Sales Data).
What each statistics page covers
This page is the hub for a series of four. All four use the same rules: counted data only, geography and period on every figure, no estimates of what anyone could borrow.
UK equity release statistics
Annual lending 2016 to 2025, who holds Britain's housing wealth, and the Locked-Up Ratio.
02£1.83tnof homes owned by over-65s, England and WalesOver-65s housing wealth
The value of homes owned by households headed by someone 65 or over, for every local authority, 2011 to 2025.
03455,778over-65 households still paying a mortgageRetirement mortgage debt
Older households with a mortgage at the 2021 Census, by region, plus the UK interest-only maturity profile.
06£14.7bnof homes passed through taxed estates, 2023 to 2024Inheritance Tax and property
HMRC data on the homes in estates that paid Inheritance Tax, set against equity release lending.
How much is lent through equity release each year?
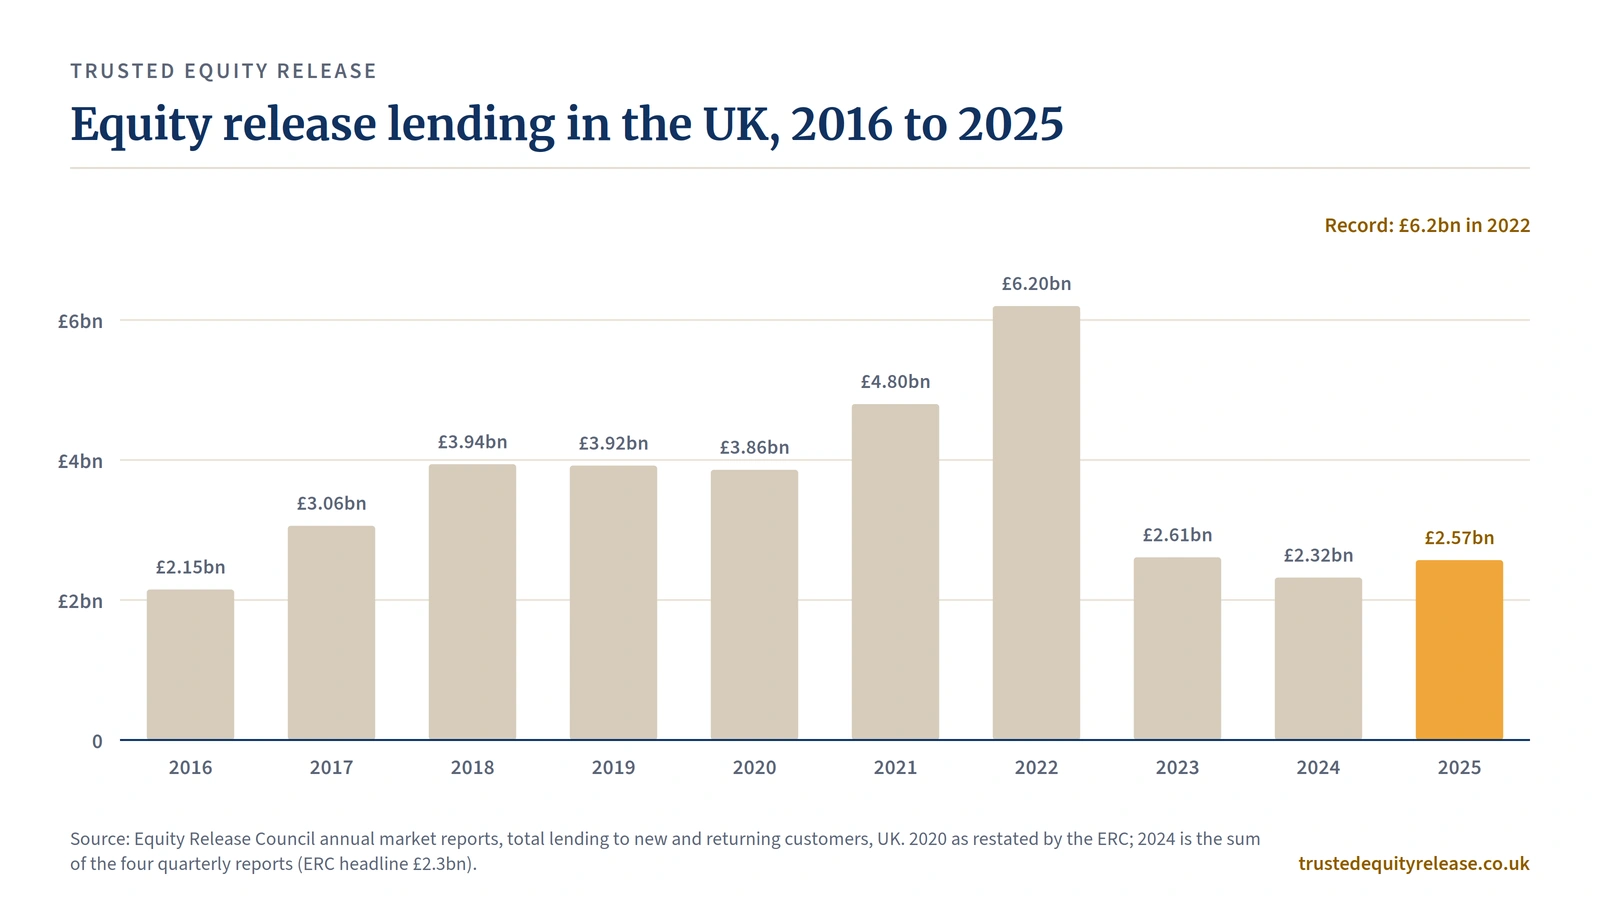
UK equity release lending was £2.57bn in 2025, the first annual rise since the 2022 record. That is 11 per cent above 2024's £2.3bn, but less than half the £6.2bn lent in 2022 (ERC).
Lending rose from £2.15bn in 2016 to around £3.9bn a year between 2018 and 2020, then climbed to £4.8bn in 2021 and £6.2bn in 2022. The ERC linked the slowdown at the end of 2022 to rate rises after the September 2022 mini-Budget, and lending fell 58 per cent in 2023. The ERC total covers new plans, drawdowns and further advances from every UK provider and advice firm.
How many people use equity release each year?
A record 93,421 customers used equity release in the UK in 2022, falling to 64,448 in 2023 (ERC). New plans fell further, from 49,285 to 26,119.
The ERC counts customer activity in a year: new plans, drawdowns from existing reserves and further advances. One person can appear more than once, so new plans are the closest measure of people entering the market.
| Year | Customers served (UK) | New plans (UK) |
|---|---|---|
| 2020 | 72,988 | 40,337 |
| 2021 | 76,154 | 40,964 |
| 2022 | 93,421 | 49,285 |
| 2023 | 64,448 | 26,119 |
The ERC's 2024 and 2025 full-year releases report customer numbers by quarter rather than for the whole year, so the table stops at 2023.
Who holds Britain's housing wealth?
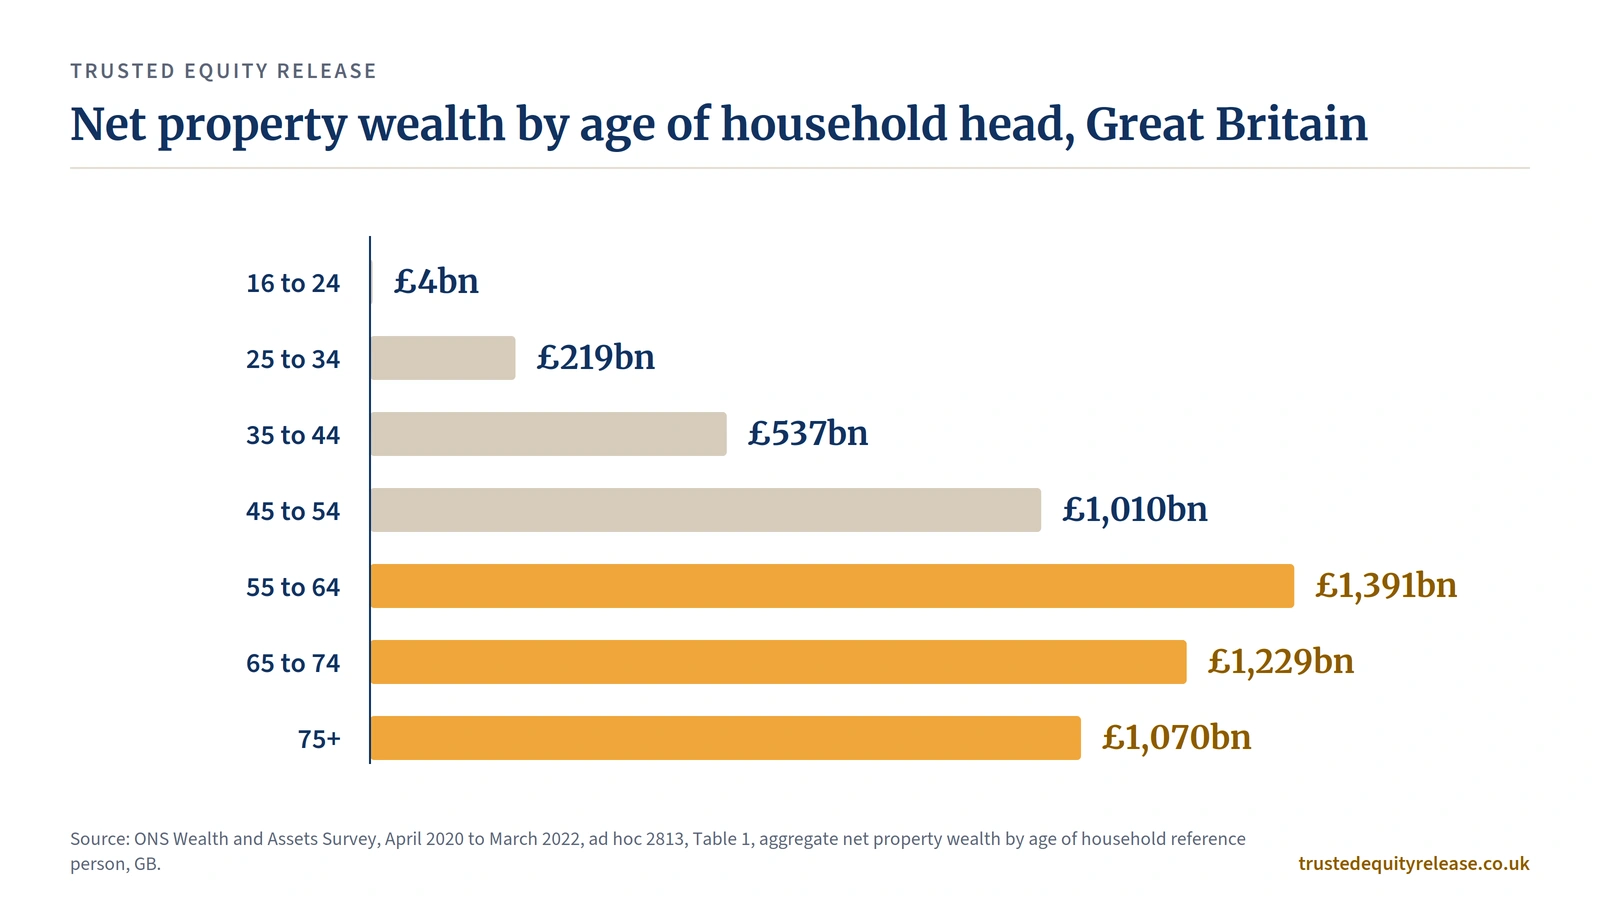
Households headed by someone aged 55 or over held £3.69 trillion of net property wealth in Great Britain between April 2020 and March 2022, 68 per cent of the £5.46 trillion total (ONS). Net property wealth is the value of all property owned, less mortgage debt.
The total splits across three age bands of the household reference person: £1.39 trillion for 55 to 64, £1.23 trillion for 65 to 74 and £1.07 trillion for 75 and over. Median net property wealth rises with age, from £181,000 for households headed by someone aged 55 to 64 to £210,000 for 75 and over, against £106,000 for all households in Great Britain (ONS, ad hoc 2813).
The Locked-Up Ratio: how little housing wealth is released
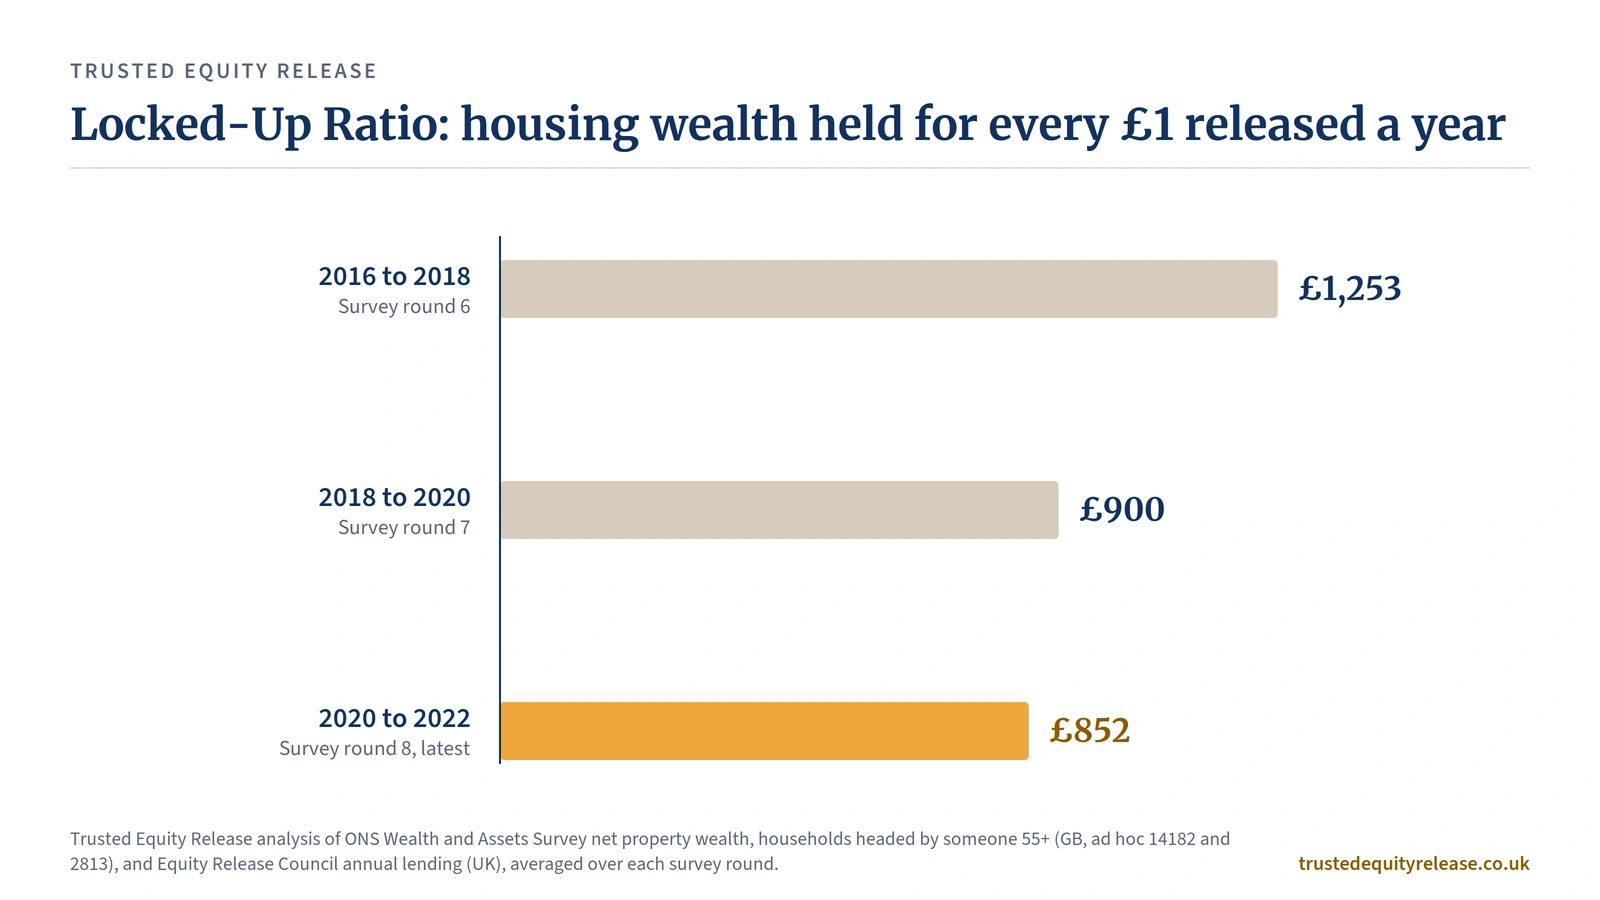
For every £1 released through equity release each year, households headed by someone aged 55 or over held £852 of net property wealth in 2020 to 2022. That is a Locked-Up Ratio of 0.12 per cent a year (Trusted Equity Release analysis of ONS and ERC data).
The ratio has narrowed across three survey rounds, from £1,253 per £1 in 2016 to 2018 to £900 in 2018 to 2020 and £852 in 2020 to 2022. Release grew faster than wealth: average annual lending rose 66 per cent across the three rounds, while net property wealth held by households headed by someone aged 55+ rose 13 per cent. For households headed by someone aged 65 or over, the latest figure is £531 held for every £1 released.
| Survey period | Net property wealth, HRP 55+ (GB) | Average annual ERC lending (UK) | Ratio, 55+ | Ratio, 65+ |
|---|---|---|---|---|
| April 2016 to March 2018 | £3.26tn | £2.61bn | 0.080% | 0.124% |
| April 2018 to March 2020 | £3.54tn | £3.93bn | 0.111% | 0.175% |
| April 2020 to March 2022 | £3.69tn | £4.33bn | 0.117% | 0.188% |
How the Locked-Up Ratio is calculated
Sources. Numerator: Equity Release Council total annual lending, UK, 2016 to 2021 (2020 as restated by the ERC at £3.86bn). Denominator: ONS Wealth and Assets Survey aggregate net property wealth by age of household reference person, Great Britain: ad hoc 14182 (April 2016 to March 2018; April 2018 to March 2020) and ad hoc 2813, Table 1 (April 2020 to March 2022).
Calculation. 1. Sum aggregate net property wealth for household reference persons aged 55 to 64, 65 to 74 and 75+ (55+), and for 65+. 2. Average ERC lending over the two calendar years that best match each April to March survey round (2016 and 2017; 2018 and 2019; 2020 and 2021). 3. Divide average annual lending by wealth for the ratio, and wealth by lending for £ held per £1 released.
Assumptions. Calendar-year lending is a one-quarter offset from the survey period. Lending is UK; wealth is Great Britain, so the ratio is slightly overstated (Northern Ireland is under 3 per cent of the UK population). Lending counts individuals aged 55+; wealth is classified by the age of the household reference person. Lending is a yearly flow; wealth is a stock, net of all mortgage debt including existing lifetime mortgages.
Coverage. Three survey rounds, April 2016 to March 2022. The next round (April 2022 to March 2024) has no confirmed ONS release date.
Validation. Numerator: FCA Product Sales Data record £2.16bn of new UK lifetime mortgage sales in 2025 against the ERC's £2.57bn; the ERC total is higher because it includes drawdowns from existing reserves (the ERC attributed £500m of 2021's £4.8bn to returning customers). Denominator: the FCA cites the same ONS aggregate of £3.7 trillion held by over-55s (MS26/1.1). The ONS notes that Wealth and Assets Survey property values run above the UK House Price Index, which would make the ratio slightly understated.
Reuse. Free to reuse with a link to this page. The data behind every figure is in the downloads below.
Why do the ERC and FCA figures differ?
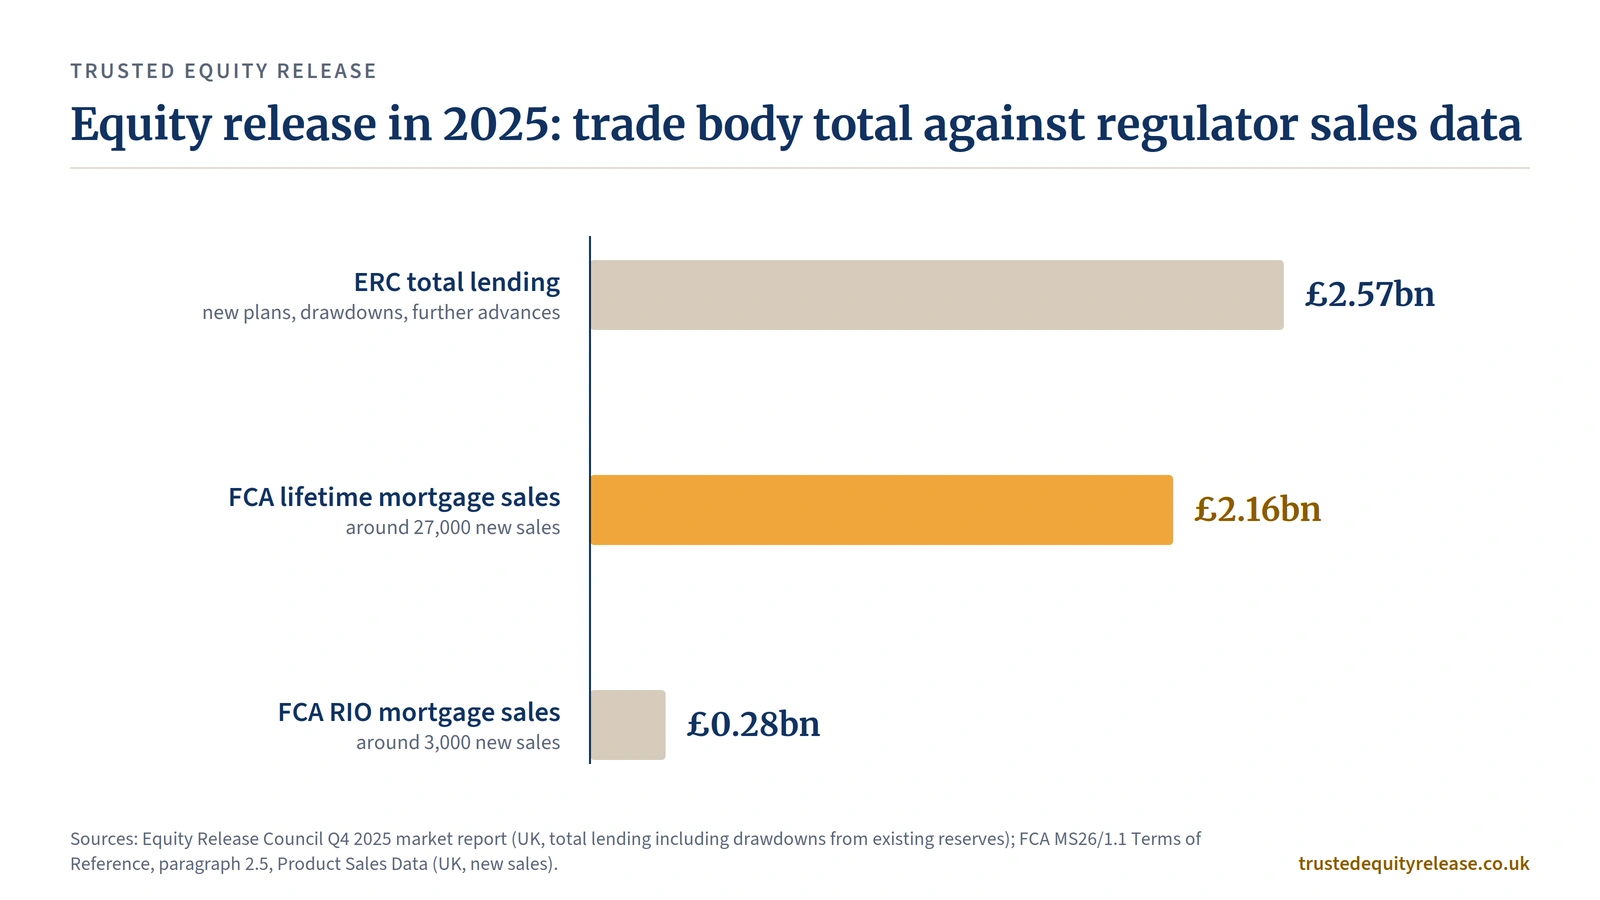
The ERC recorded £2.57bn of UK equity release lending in 2025, while FCA Product Sales Data show £2.16bn of new lifetime mortgage sales, because the two sources count different things. Neither body has published a reconciliation.
The ERC total comes from provider returns and includes drawdowns from reserves agreed in earlier years, plus further advances. Product Sales Data record new regulated sales. The FCA also records around 3,000 retirement interest-only (RIO) mortgages worth £282m in 2025, which the ERC does not count as equity release, and puts combined new sales at around £2.4bn (FCA MS26/1.1 Terms of Reference, paragraphs 1.4 and 2.5).
Lifetime mortgages make up almost the entire market
Lifetime mortgages account for more than 99 per cent of the UK equity release market (ERC), and the FCA recorded only 25 home reversion sales in the four years from 2022 to 2025. Home reversion involves selling all or part of a home rather than borrowing against it. I advise on lifetime mortgages only; see how equity release advice works.
FCA Product Sales Data for lifetime and RIO mortgages in the UK, 2022 to 2025, show a median borrower age of around 71 and a median property value of £290,000 to £350,000. The median loan-to-value ratio was around 15 per cent for lifetime mortgages and 27 per cent for RIO mortgages, and more than 90 per cent of lifetime mortgage sales went through an intermediary (FCA MS26/1.1).
What the Equity Release Council product standards require
Plans that meet ERC standards must carry six product standards; the sixth, on long-term care, took effect on 6 May 2025. They cover interest rates, a home for life, moving home, negative equity, repayments and long-term care.
No Negative Equity Guarantee (NNEG): "The product must have a “no negative equity guarantee”. This means that when your property is sold, and agents’ and solicitors’ fees have been paid, even if the amount left is not enough to repay the outstanding loan to your provider, neither you nor your estate will be liable to pay any more."
Long-term Care: "If a customer needs to move permanently into long-term care – whether in a care home or with relatives providing care – any early repayment charge will be waived by the Lender upon receipt of a medical practitioner’s certificate and the terms and conditions of the loan have been met"
Source: Equity Release Council, Standards 2.0 announcement, May 2025. Quoted verbatim, including the ERC's own punctuation.Before May 2025, early repayment charges were waived only on moves into formal care such as a care home; the new standard extends the waiver to people who move in with relatives to receive care. The right to make penalty-free partial repayments has applied to all new ERC-standard plans since 28 March 2022 (ERC).
How reliable are these figures?
The lending figures are counted rather than estimated, but the wealth figures come from a survey the ONS no longer classes as accredited official statistics.
- ERC data are whole-of-market returns from providers and advice firms, UK. The ERC is the trade body for the sector.
- The Wealth and Assets Survey covers Great Britain, not the UK. Its April 2020 to March 2022 round was run by telephone during the pandemic, and the ONS suspended its accreditation from that round in June 2025.
- The ERC widened its remit to all regulated later life lending in December 2025. No break in the equity release series has been announced.
- The FCA's later life mortgages market study (MS26/1) expects to publish interim findings in Q4 2026.
Source key
| Tag | Source and table | Coverage | Cadence |
|---|---|---|---|
| ERC | Equity Release Council market reports and full-year statistics (FY2021 media alert; Q4 2022; Q4 and FY 2023; Q4 2025 market report); Standards 2.0 announcement, May 2025 | UK | Quarterly; full year each January |
| ONS | ONS Wealth and Assets Survey: ad hoc 2813, Table 1 (April 2020 to March 2022, published 16 May 2025); ad hoc 14182 (April 2016 to March 2020, published 18 January 2022) | Great Britain | Biennial rounds; next round date to be announced |
| FCA | FCA MS26/1.1, Market study into later life mortgages: Terms of Reference (20 March 2026), paragraphs 1.2, 1.4, 2.5, 2.7 and 3.7, citing Product Sales Data | UK | One-off; interim findings due Q4 2026 |
| Analysis | Trusted Equity Release Locked-Up Ratio, built from the ONS and ERC data above | GB wealth, UK lending | Updated with each new survey round |
Cite this data
Every figure on this page is free to quote with a link back. Jeremy is available for comment on the numbers: jeremy@trustedequityrelease.co.uk.
Trusted Equity Release (2026). UK Equity Release Statistics 2026. https://www.trustedequityrelease.co.uk/guides/equity-release-statistics/
<a href="https://www.trustedequityrelease.co.uk/guides/equity-release-statistics/">UK Equity Release Statistics 2026</a>, Trusted Equity Release, 2026
Trusted Equity Release (2026) UK Equity Release Statistics 2026. Locked-Up Ratio: Trusted Equity Release analysis based on ONS Wealth and Assets Survey and Equity Release Council data. Available at: https://www.trustedequityrelease.co.uk/guides/equity-release-statistics/ (Accessed: [date]).
Questions people ask about these figures
How much equity release was taken out in the UK in 2025?
How many people take out equity release each year?
What is the average age of equity release customers?
What was the record year for equity release lending?
How much housing wealth do over-55s hold?
What share of equity release is lifetime mortgages?
What is the Locked-Up Ratio?

Trusted Equity Release is a trading name of Pellucid Ltd, authorised and regulated by the Financial Conduct Authority, FRN 981845. About Jeremy.