
Key figures to cite
Each figure states its source and period. Copy the text, or the HTML with a link back to this page.
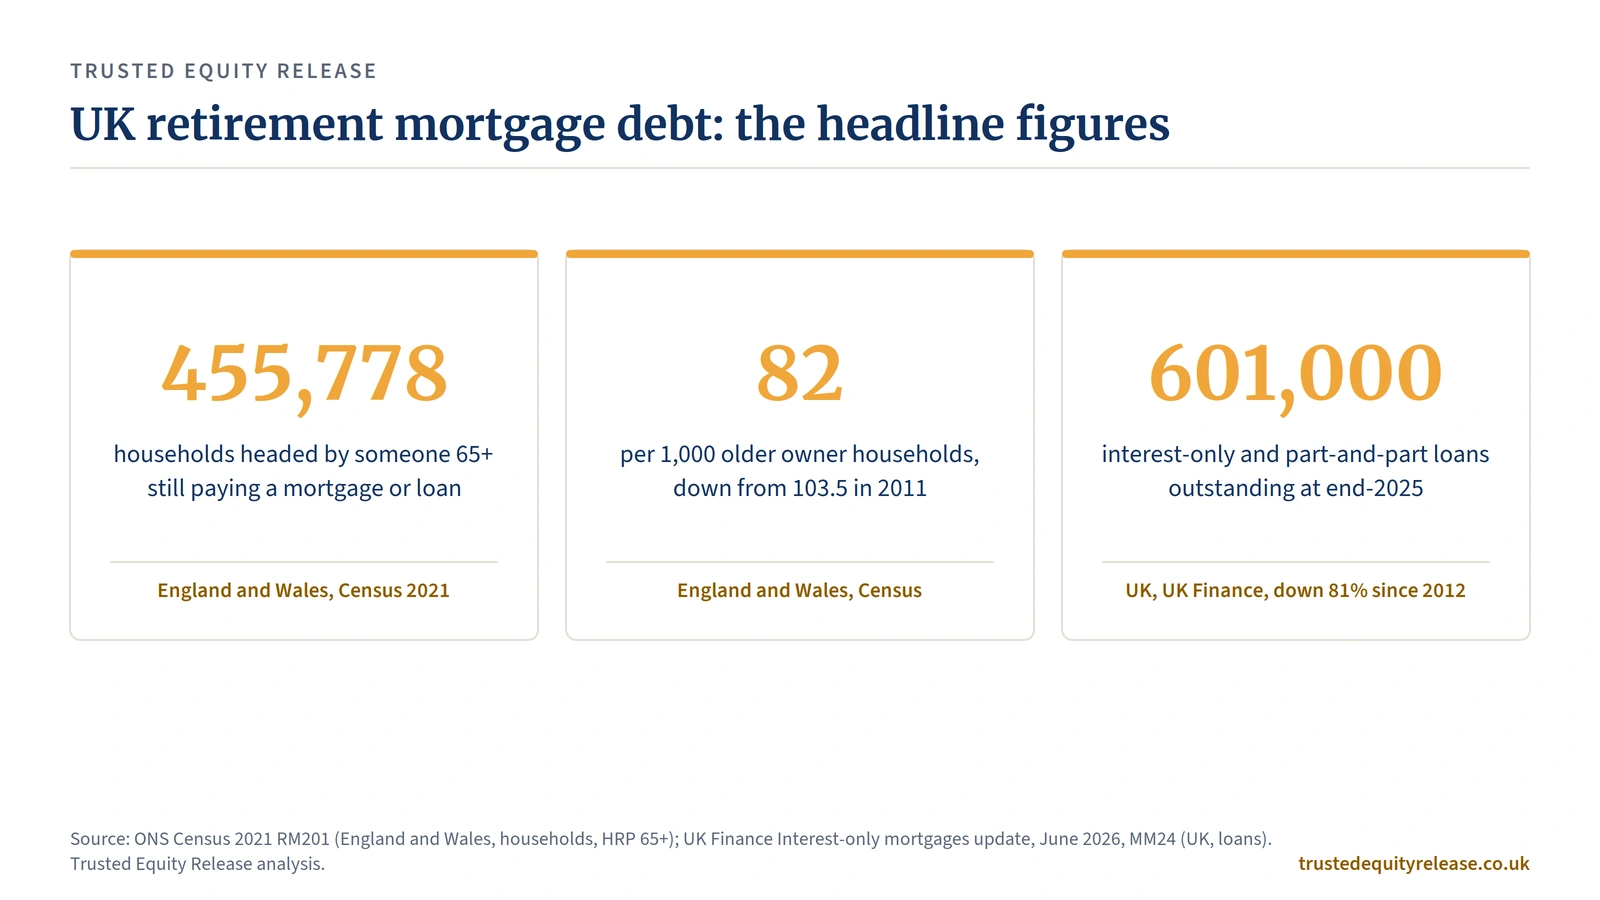
At the 2021 Census, 455,778 households in England and Wales with a Household Reference Person aged 65 or over owned their home with a mortgage, loan or shared ownership (ONS Census 2021 RM201).
In 2021, 82.0 in every 1,000 older owner households in England and Wales were still mortgaged, down from 103.5 in 2011 (Trusted Equity Release analysis of Census 2011 and 2021).
The over-65 mortgage rate fell between 2011 and 2021 in 313 of 318 local authorities in England and Wales. It rose only in Camden, Kensington and Chelsea, Redbridge, Richmond upon Thames and Westminster.
At the end of 2025 there were 445,000 pure interest-only and 156,000 part-and-part homeowner mortgages outstanding in the UK, 81% fewer than in 2012 (UK Finance).
At the end of 2025, 15,000 UK interest-only loans worth £3bn had passed their term end without being repaid, down 38% in a year (UK Finance).
In 2024 Q1, 42% of new UK mortgage lending ran beyond the borrower's 67th birthday, up from 27% in 2019 Q1 (Bank of England staff analysis of FCA data).
In 2024, 9% of UK residential mortgage holders aged 55+ said they did not think they could afford their mortgage payments in retirement and did not know what they would do (FCA Financial Lives).
What each statistics page covers
This page is one of a series of four; the hub is UK equity release statistics. All four use the same rules: counted data only, geography and period on every figure, no estimates of what anyone could borrow.
UK equity release statistics
Annual lending 2016 to 2025, who holds Britain's housing wealth, and the Locked-Up Ratio.
02£1.83tnof homes owned by over-65s, England and WalesOver-65s housing wealth
The value of homes owned by households headed by someone 65 or over, for every local authority, 2011 to 2025.
03This page455,778over-65 households still paying a mortgageRetirement mortgage debt
Older households with a mortgage at the 2021 Census, by region, plus the UK interest-only maturity profile.
06£14.7bnof homes passed through taxed estates, 2023 to 2024Inheritance Tax and property
HMRC data on the homes in estates that paid Inheritance Tax, set against equity release lending.
How many over-65s still have a mortgage?
At the 2021 Census, 455,778 households in England and Wales headed by someone aged 65 or over still owned their home with a mortgage, loan or shared ownership. That is 8.2% of the 5.56 million older owner households, or 6.4% of all 7.17 million households headed by someone 65+ (ONS Census 2021 RM201).
The Census category combines mortgages, other secured loans and shared ownership, so it is wider than conventional mortgage debt. The English Housing Survey 2020-21 found that 95% of owners aged 65 or over in England had no mortgage, 4% had an ordinary mortgage and 1% had an equity release loan (MHCLG). In 2024-25, 79% of households headed by someone 65+ in England were owner occupiers and 74% owned outright (English Housing Survey).
Household Reference Person (HRP). The Census and English Housing Survey classify each household by the age of one person, the Household Reference Person, usually the highest earner. A household is counted as "65+" when that person is 65 or over, whatever the ages of other members.
Census tenure category, verbatim: "Owned: Owns with a mortgage or loan or shared ownership" (ONS Census 2021).
Where is retirement mortgage debt highest?
London has the highest over-65 mortgage rate in England and Wales, at 120.9 mortgaged households per 1,000 older owners in 2021, and the East Midlands the lowest at 70.7. London holds 12.0% of older mortgaged households in England and Wales but only 8.1% of older owner households (Trusted Equity Release analysis of Census 2021).
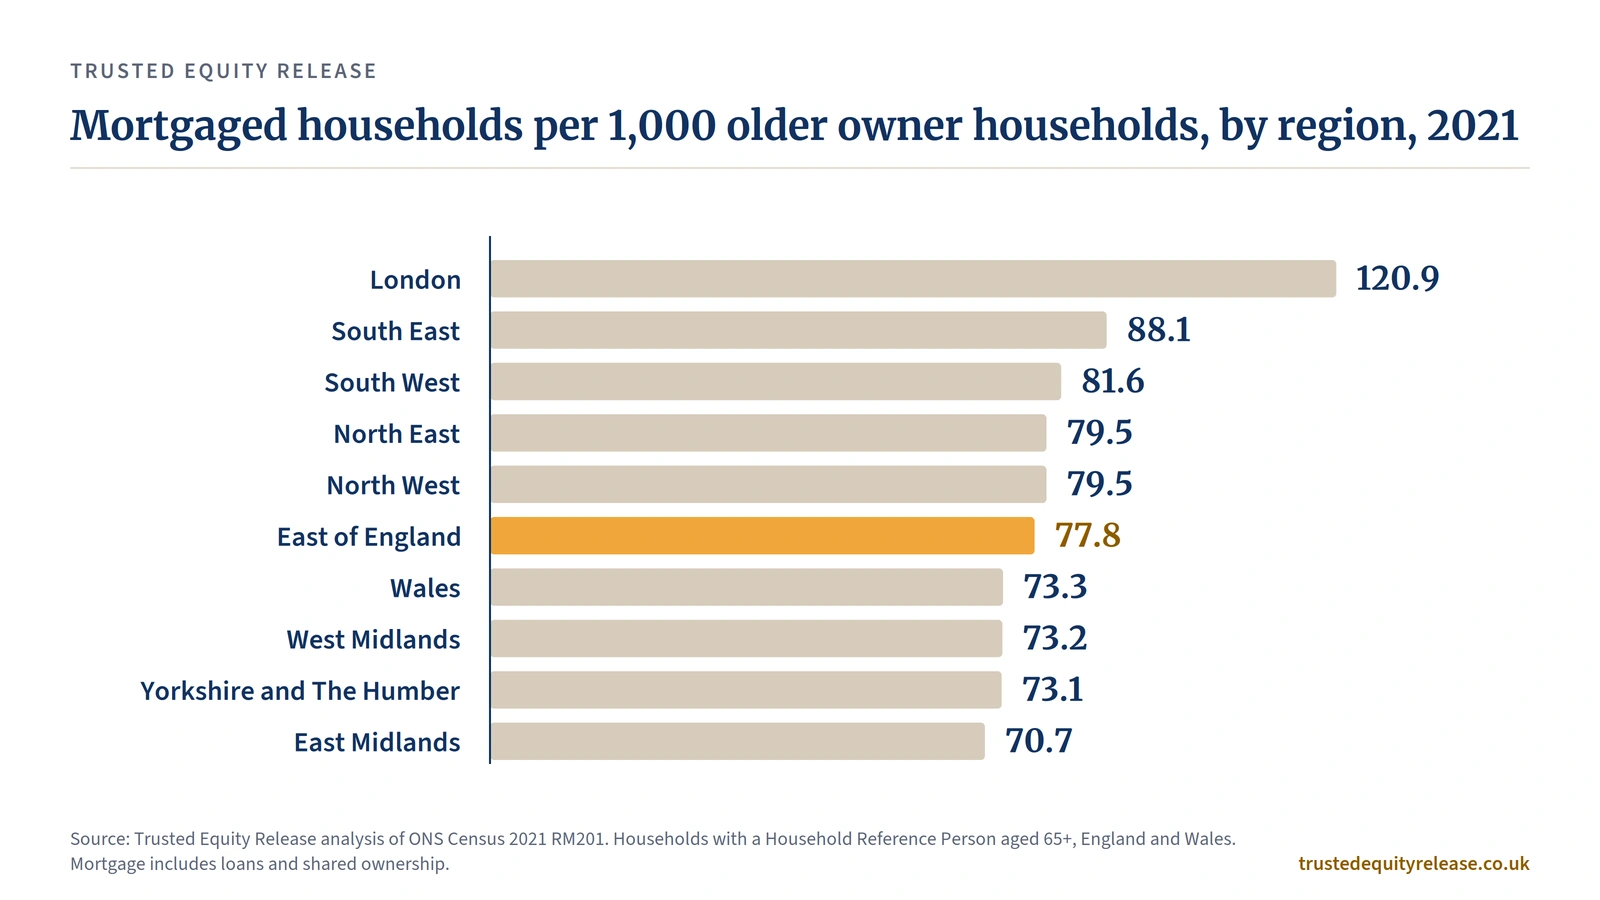
At local authority level the range is wider. The highest rates are in inner London, where older owner populations are small, and the lowest are in districts of the East Midlands, the West Midlands and the South Wales valleys.
| Local authority | Older mortgaged households, 2021 | Rate per 1,000 older owners, 2021 | Rate, 2011 |
|---|---|---|---|
| Highest five | |||
| Tower Hamlets | 773 | 214.4 | 265.3 |
| Newham | 1,342 | 173.3 | 187.5 |
| Hackney | 780 | 167.2 | 216.2 |
| Westminster | 1,342 | 166.2 | 163.1 |
| Kensington and Chelsea | 1,159 | 165.1 | 135.7 |
| Lowest five | |||
| Rhondda Cynon Taf | 1,448 | 56.8 | 71.2 |
| Merthyr Tydfil | 317 | 55.8 | 75.8 |
| Ashfield | 708 | 55.7 | 76.9 |
| Dudley | 1,914 | 55.5 | 73.0 |
| Amber Valley | 790 | 52.5 | 69.7 |
East of England and Cambridgeshire
The East of England sits just below the national rate, at 77.8 per 1,000 older owners, and holds 49,702 older mortgaged households, 10.9% of the England and Wales total. That share matches the FCA's finding that the Eastern region holds 10% of the UK's regulated interest-only stock (FCA, August 2023).
| Area | Older mortgaged households, 2021 | Rate, 2021 | Rate, 2011 | Rank of 318 |
|---|---|---|---|---|
| South Cambridgeshire | 1,393 | 85.1 | 104.8 | 104 |
| Cambridge | 632 | 82.2 | 88.9 | 134 |
| Peterborough | 1,167 | 79.8 | 106.0 | 162 |
| Fenland | 919 | 76.8 | 93.9 | 187 |
| Huntingdonshire | 1,444 | 75.0 | 100.0 | 200 |
| East Cambridgeshire | 678 | 74.4 | 90.5 | 206 |
| England and Wales | 455,778 | 82.0 | 103.5 |
The over-65 mortgage rate fell in almost every area
Between 2011 and 2021 the share of older owners still paying a mortgage fell from 103.5 to 82.0 per 1,000 in England and Wales, and it fell in 313 of 318 local authorities. The number of older mortgaged households fell 3.4%, from 471,874 to 455,778, while older owner households rose 21.9%, from 4.56 million to 5.56 million.
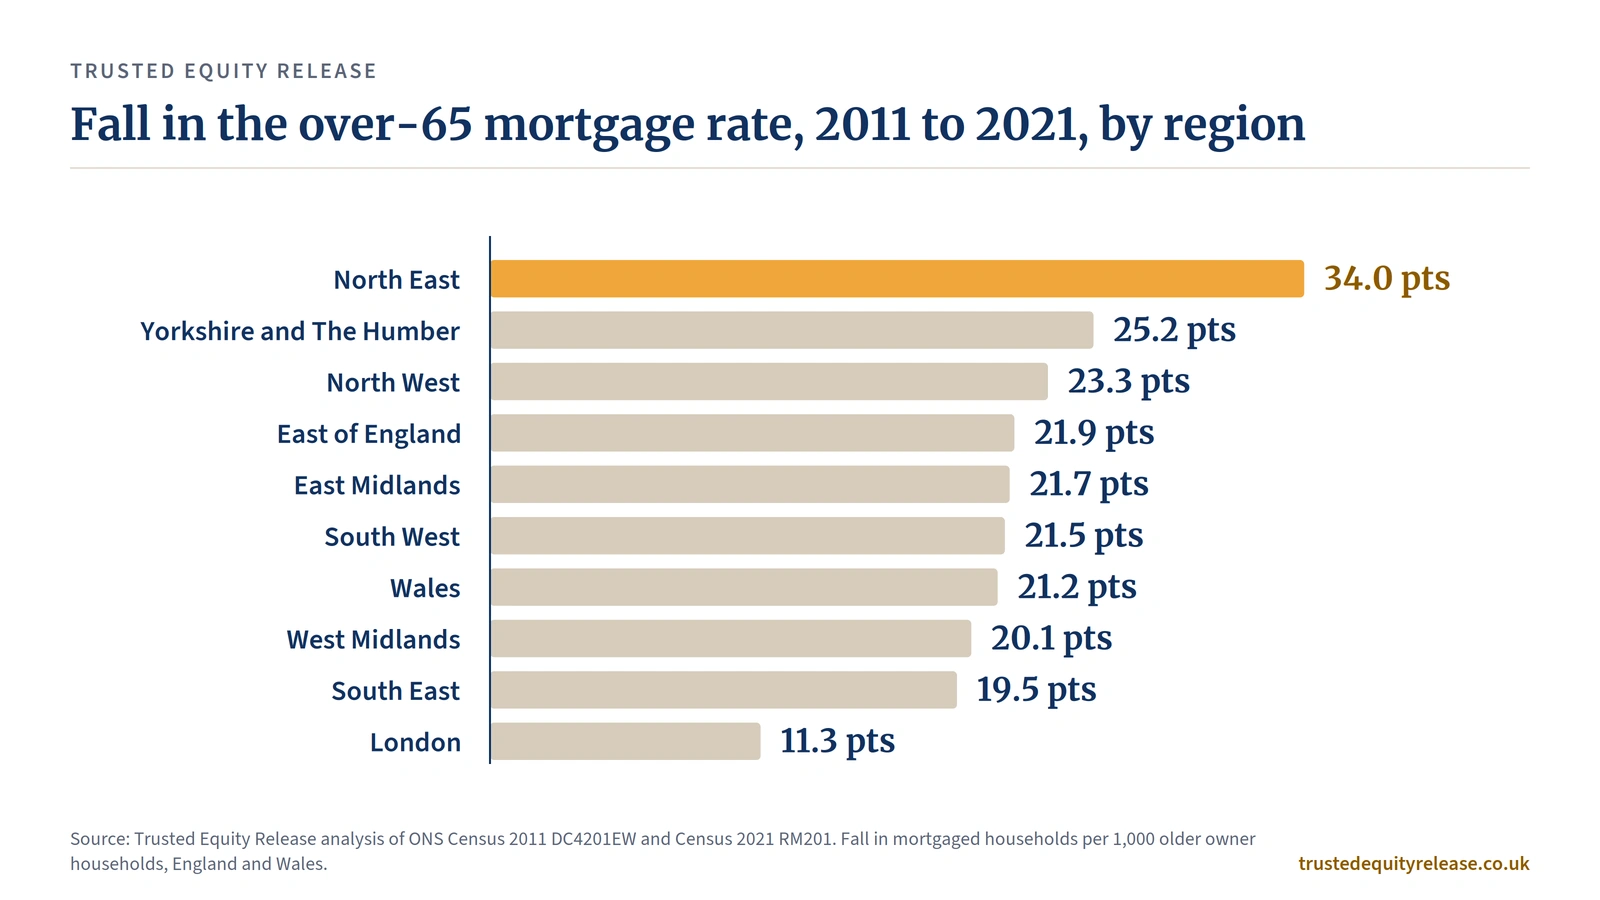
London and the South East were the only regions where the number of older mortgaged households rose, by 4.8% and 0.6%. The North East saw the largest fall in both the rate and the count, down 11.8% to 20,302 households.
How many interest-only mortgages are left?
UK Finance counted 601,000 interest-only and part-and-part homeowner mortgages in the UK at the end of 2025, down from 3.2 million in 2012. Of these, 445,000 were pure interest-only (£99bn) and 156,000 were part and part (£40bn). The pure interest-only stock fell 17.7% in 2025 alone (UK Finance).
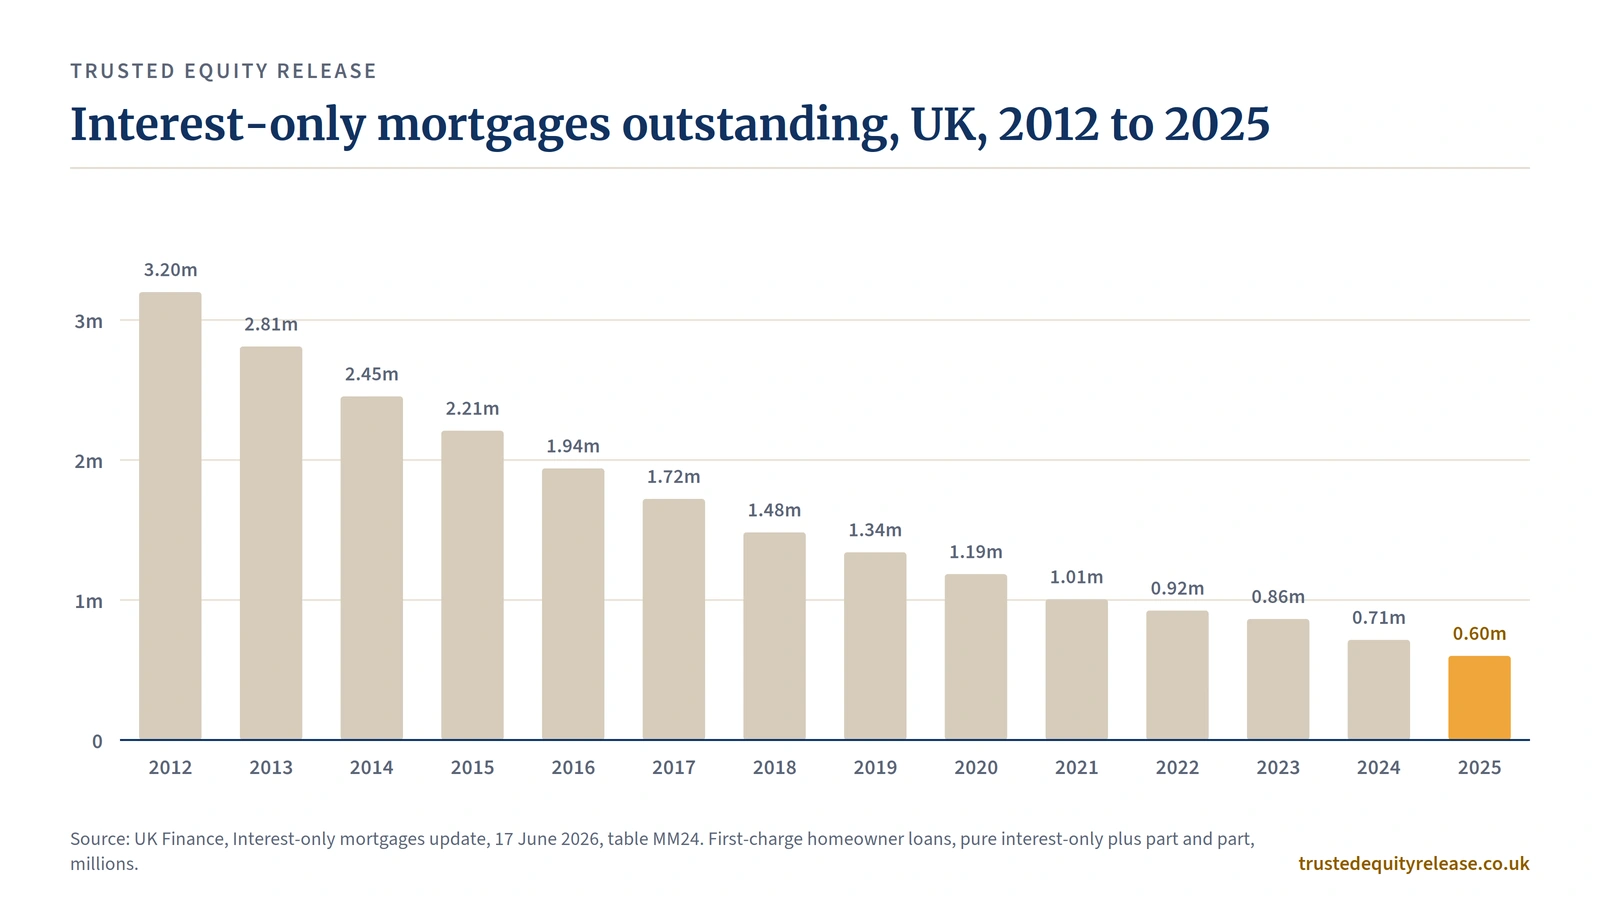
UK Finance also reports that 60,000 loans remain in the cohort maturing between 2021 and 2027, seven per cent of its 2012 size, and 526,000 loans (£127bn) are due to mature in 2028 or later. Only 19,000 pure interest-only loans had a loan-to-value above 75% at the end of 2025, against 903,000 in 2012.
When do the remaining interest-only mortgages mature?
FCA data show interest-only maturities peaking in 2031 and 2032, when around 91,000 and 95,000 mortgages are due to reach the end of their term. The median interest-only borrower was 56, with a median balance of £140,000 and eight years left to run (FCA Product Sales Data, stock at the end of 2022).
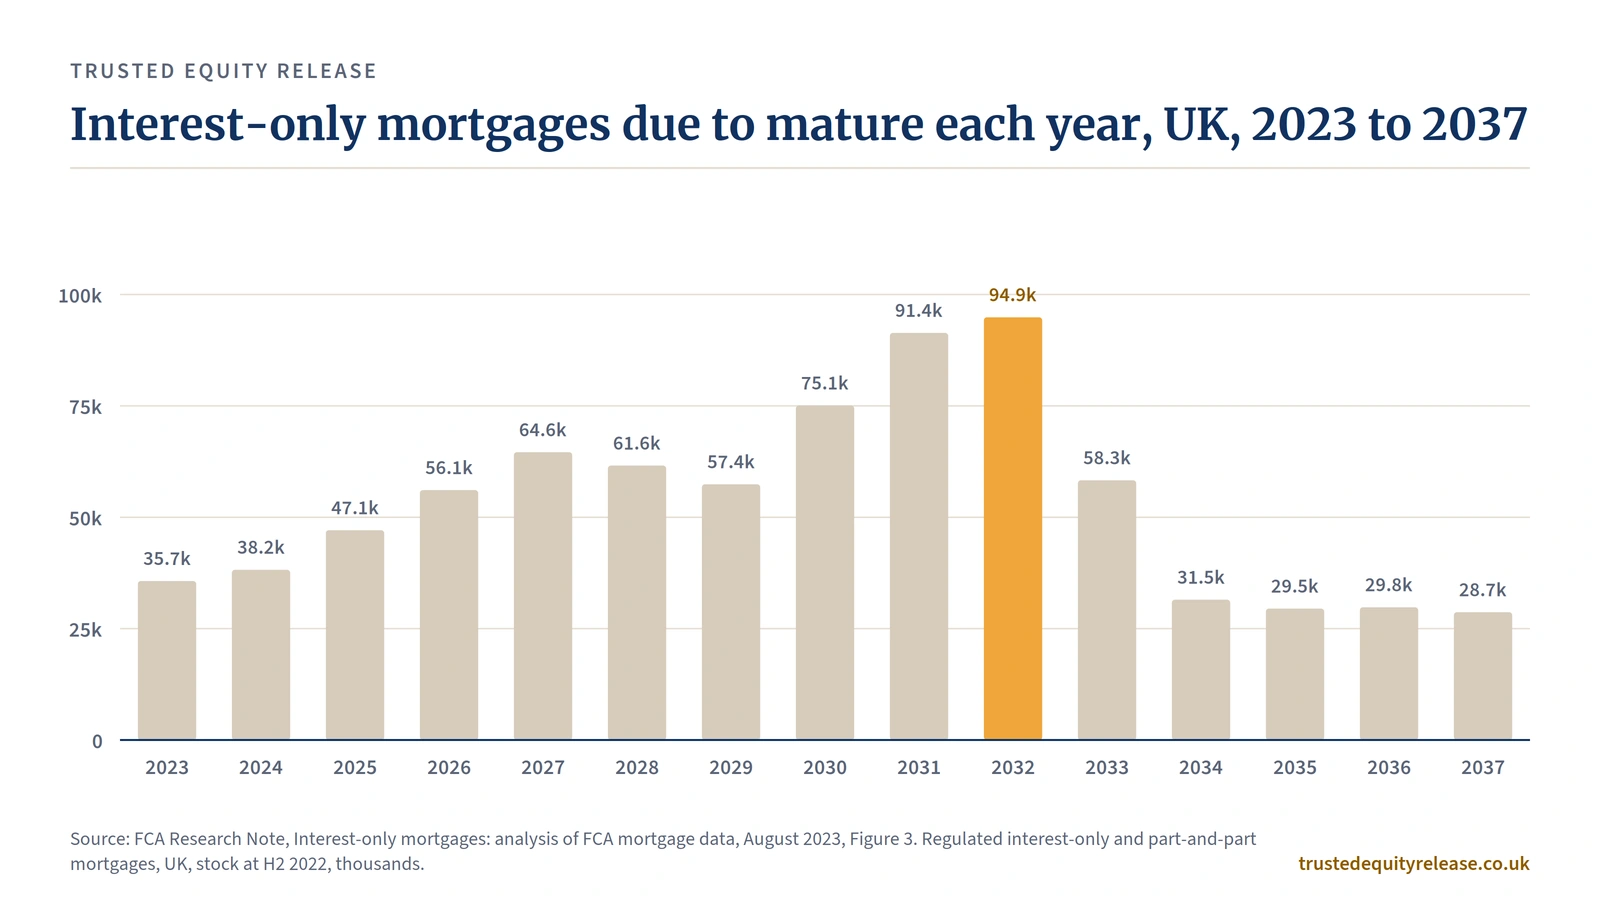
UK Finance and the FCA count the interest-only stock differently, and the two figures should be read side by side rather than combined.
| End of 2022 | UK Finance | FCA Product Sales Data |
|---|---|---|
| Interest-only and part-and-part stock | 924,000 loans | 993,703 mortgages |
| Past term end | 27,000 | 21,934 |
| Coverage | First-charge homeowner loans, grossed up from member returns. Excludes lifetime and retirement interest-only mortgages and loans held by unregulated entities. | All regulated mortgages reported by lenders and administrators, including closed books. |
New mortgages are running further into retirement
The share of new UK mortgage lending running past the borrower's 67th birthday rose from 27% in 2019 Q1 to 42% in 2024 Q1, according to Bank of England staff analysis of FCA data. Over the same period the share of new mortgages with terms of 30 years or more reached 50%, against 12% in 2005 Q4 (Bank Underground, October 2024).
The FCA's later life mortgages market study found that in each of the last five years around 6% of standard mortgage sales went to borrowers aged 55 or over who will be 68 or over at the end of their term, about 350,000 sales since 2021 (FCA MS26/1.1, March 2026). Neither figure is published as a regular series.
State pension age, verbatim (DWP): "The State Pension age for men and women will now increase to 67 between 2026 and 2028." and "Under the Pensions Act 2007 the State Pension age for men and women will increase from 67 to 68 between 2044 and 2046."
What do older mortgage holders say about repaying?
In 2024, 25% of UK residential mortgage holders aged 55 or over had an interest-only or part-and-part mortgage, compared with 11% of all mortgage holders. Across all ages, 1.6 million adults held an interest-only or part-and-part mortgage (FCA Financial Lives 2024).
| Interest-only and part-and-part holders, UK, 2024 | Share |
|---|---|
| Less confident in ability to repay the capital than when the mortgage was taken out | 27% |
| Mortgage term ends within the next five years | 39% |
| Of those, recall lender contact about repaying in the last two years | 42% |
| Have never thought about how to repay | 8% |
| Do not know how they will repay | 14% |
Two tracks: legacy debt falling, new debt building
The figures describe two separate trends: the legacy interest-only book is shrinking fast, while new lending increasingly runs into retirement. The 2021 Census captures the first trend. Borrowers taking long terms since 2019 will mostly not reach 65 until the 2030s and 2040s, so Census 2021 cannot yet show them.
This is Trusted Equity Release's reading of the data rather than a forecast. The fall from 103.5 to 82.0 per 1,000 older owners between 2011 and 2021 coincides with the UK interest-only stock falling by more than two thirds from 2012 to 2021 (UK Finance). Whether the rate rises again will first be measurable at Census 2031.
Over-65 Mortgage Rate: how we calculated it
The Over-65 Mortgage Rate is the number of mortgaged households for every 1,000 owner households headed by someone aged 65 or over, calculated for every local authority in England and Wales at the 2011 and 2021 Censuses. It is not published by ONS in this form.
How the Over-65 Mortgage Rate is calculated
Sources. ONS Census 2021 table RM201, Tenure by age, Household Reference Persons (Nomis NM_2301_1). ONS Census 2011 table DC4201EW, Tenure by ethnic group by age, Household Reference Persons (Nomis NM_710_1), all ethnic groups.
Calculation. 1. Take owner households with an HRP aged 65+: "owns outright" and "owns with a mortgage or loan or shared ownership". 2. For 2011, sum the 65 to 74, 75 to 84 and 85+ bands. 3. Rate = mortgaged households divided by (outright plus mortgaged) households, multiplied by 1,000. 4. Change = 2021 rate minus 2011 rate.
Boundaries. 2011 districts are aggregated to April 2023 local authorities, including Buckinghamshire, Dorset, Bournemouth Christchurch and Poole, East and West Suffolk, North and West Northamptonshire, Cumberland, Westmorland and Furness, North Yorkshire and Somerset. The mergers were of whole districts, so no apportioning is needed.
Assumptions. The mortgage category includes secured loans and shared ownership, and may include some equity release loans, so it is wider than conventional mortgage debt. Census counts are perturbed; rates for local authorities with small older populations carry more noise.
Coverage. England and Wales, households, Census days 27 March 2011 and 21 March 2021. Scotland (Census 2022) uses a different tenure classification and Northern Ireland publishes tenure for HRPs aged 66+ only, so neither is combined into this measure.
Validation. Local authority counts sum to the published England and Wales totals within 11 households. For England the 2021 rate of 82.6 per 1,000 older owners compares with the English Housing Survey 2020-21 estimate of 4% ordinary mortgages plus 1% equity release among owners 65+, about 50 per 1,000. The Census figure is higher because it includes shared ownership and other loans and is a full count rather than a sample. The East of England's 10.9% share of older mortgaged households matches its 10% share of the UK interest-only stock in FCA data.
Reuse. Free to reuse with a link to this page. The data behind every figure is in the downloads below.
Source key
| Tag | Source and table | Geography and unit | Next release |
|---|---|---|---|
| ONS Census 2021 | Census 2021 RM201, Tenure by age, Household Reference Persons, released 28 March 2023. Nomis NM_2301_1. | England and Wales, households | Census 2031 |
| ONS Census 2011 | Census 2011 DC4201EW, Tenure by ethnic group by age, Household Reference Persons. Nomis NM_710_1. | England and Wales, households | Fixed |
| UK Finance | Interest-only mortgages update, 17 June 2026, tables MM24, MM25, MM26. | UK, loans | 16 June 2027 (provisional) |
| FCA, August 2023 | Research Note: Interest-only mortgages: analysis of FCA mortgage data, 15 August 2023, Figures 1, 3 and 4 (PSD007). | UK, regulated mortgages | One-off |
| FCA Financial Lives | Financial Lives 2024 survey: Mortgages, selected findings, June 2025. | UK, adults | Next survey wave |
| FCA MS26/1.1 | Later life mortgages market study, Terms of Reference, 20 March 2026, paragraph 3.5. | UK, sales | One-off |
| Bank Underground | 30+ year mortgages: are these the new norm?, 17 October 2024. Staff blog, not an official Bank view. | UK, new lending | One-off |
| English Housing Survey | 2024-25 age cohorts report, 14 May 2026; Older people's housing 2020-21. | England, households | Annual |
| DWP | State Pension age timetables. | UK, people | On legislative change |
Cite this data
Every figure on this page is free to quote with a link back. Jeremy is available for comment on the numbers: jeremy@trustedequityrelease.co.uk.
Trusted Equity Release (2026). UK Retirement Mortgage Debt Statistics 2026. https://www.trustedequityrelease.co.uk/guides/retirement-mortgage-debt-statistics/
<a href="https://www.trustedequityrelease.co.uk/guides/retirement-mortgage-debt-statistics/">UK Retirement Mortgage Debt Statistics 2026</a>, Trusted Equity Release, 2026
Trusted Equity Release (2026) UK Retirement Mortgage Debt Statistics 2026. Over-65 Mortgage Rate: Trusted Equity Release analysis based on ONS Census 2011 and 2021 data. Available at: https://www.trustedequityrelease.co.uk/guides/retirement-mortgage-debt-statistics/ (Accessed: [date]).
Questions people ask about these figures
How many people over 65 have a mortgage in the UK?
How many interest-only mortgages are still outstanding in the UK?
Is the number of older homeowners with a mortgage rising or falling?
Which area has the highest share of over-65s with a mortgage?
When is the state pension age rising to 67?
How many interest-only mortgages are past their end date?
Are more mortgages running into retirement?
What share of mortgage holders over 55 are interest-only?

Trusted Equity Release is a trading name of Pellucid Ltd, authorised and regulated by the Financial Conduct Authority, FRN 981845. About Jeremy.