
Key figures to cite
Each figure states its source and period. Copy the text, or the HTML with a link back to this page.
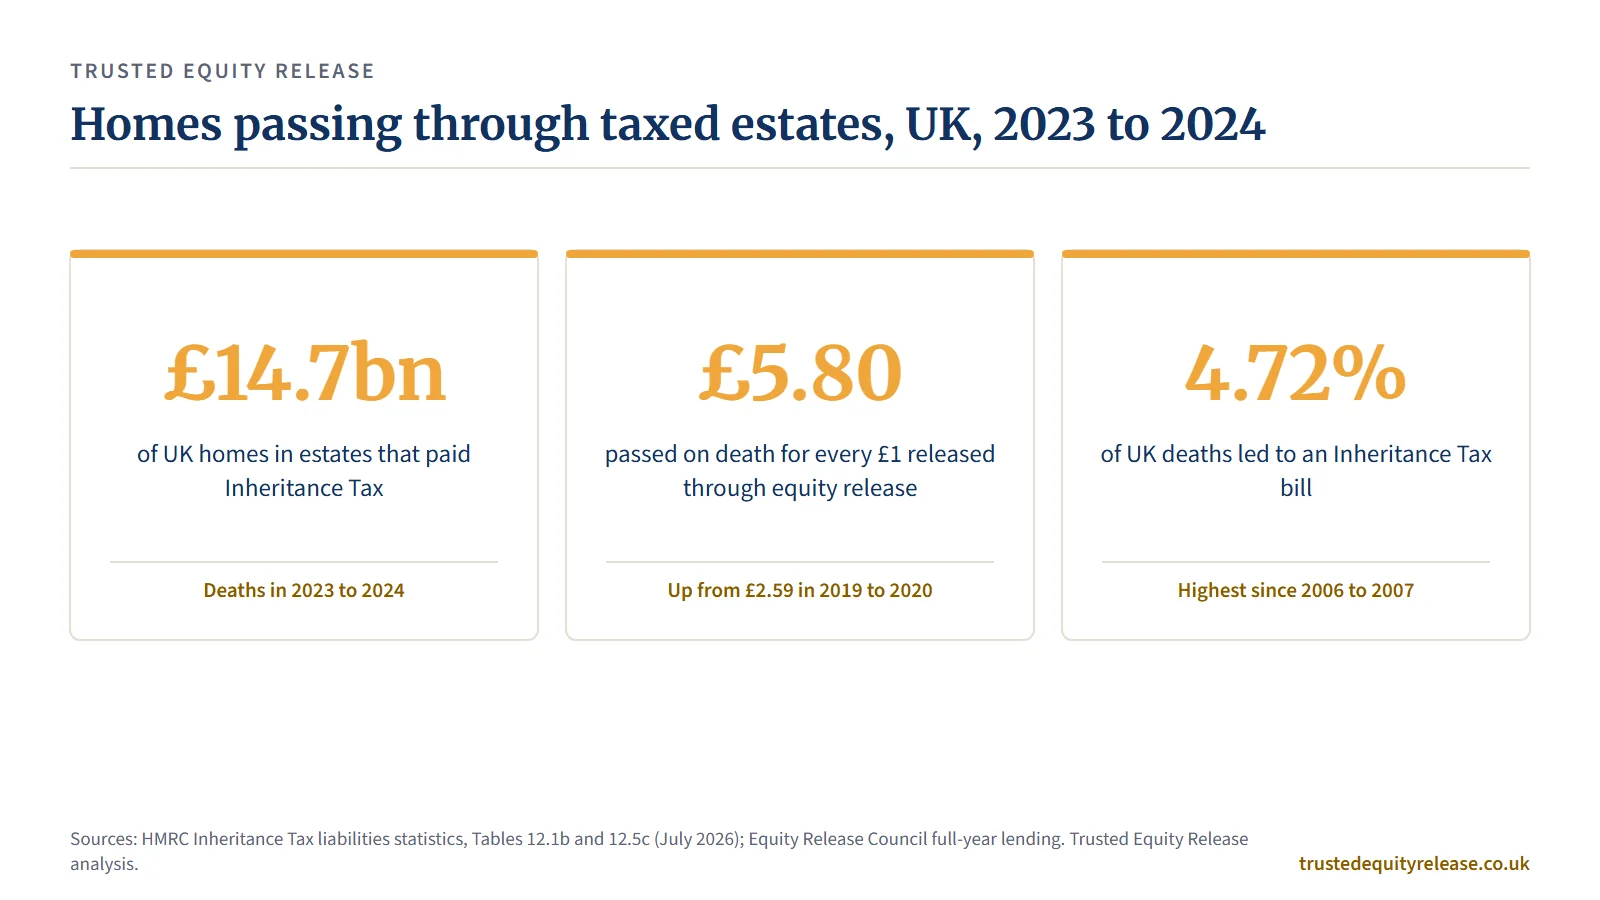
UK estates that paid Inheritance Tax on deaths in the 2023 to 2024 tax year held £14.7bn of UK residential property, 35.9% of their gross value (HMRC Table 12.5c).
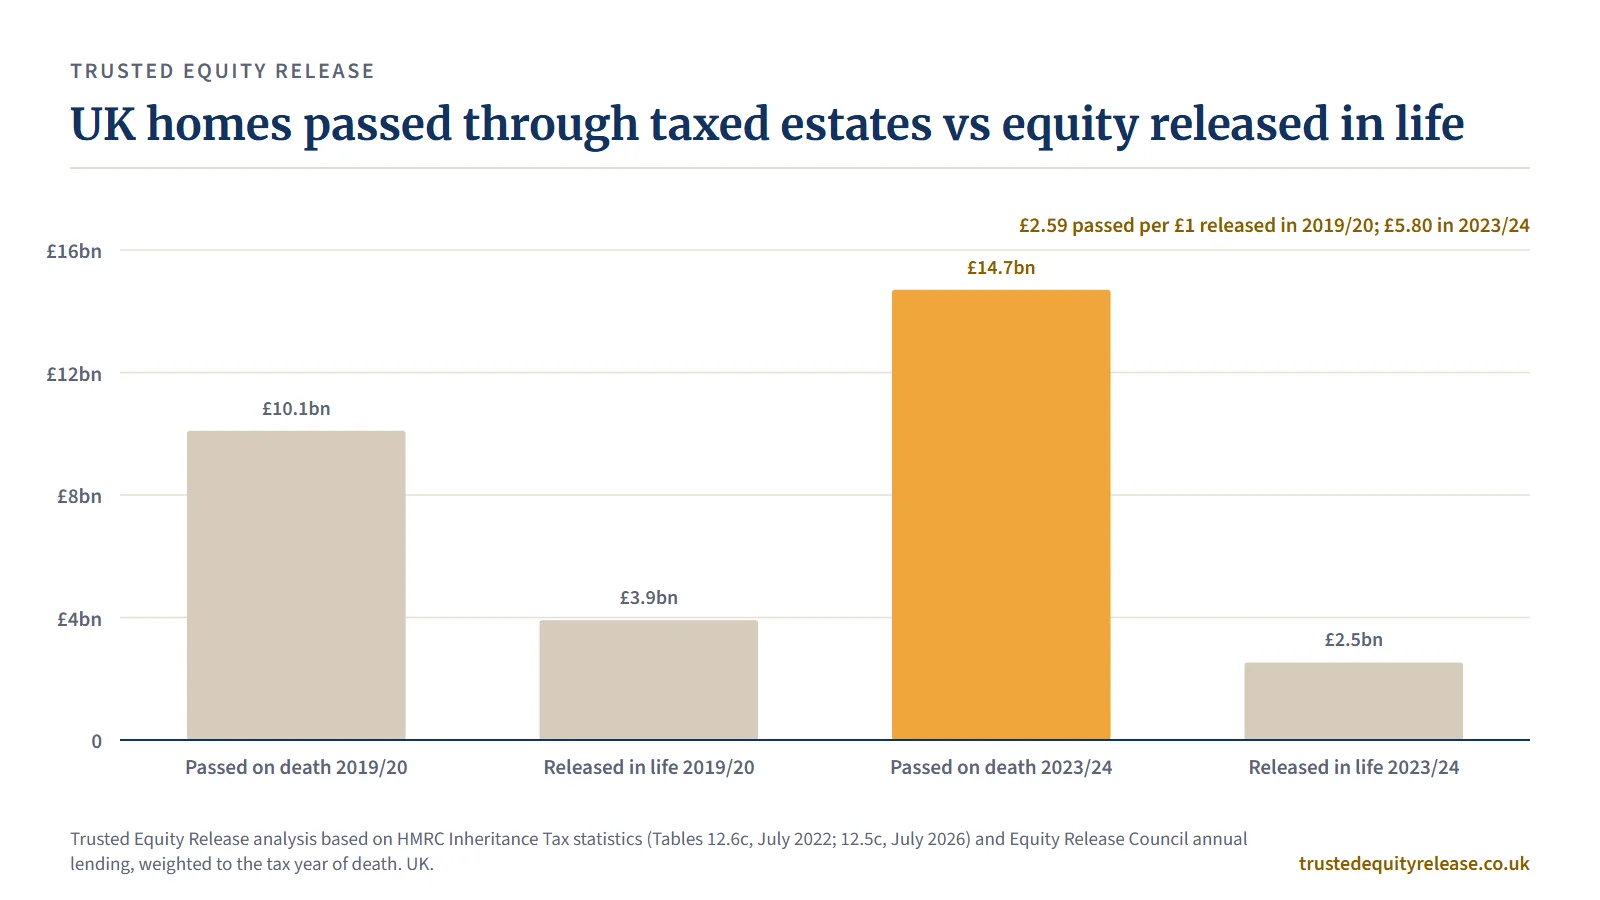
In 2023 to 2024, £5.80 of UK homes passed through taxpaying estates for every £1 released through equity release, up from £2.59 in 2019 to 2020 (Trusted Equity Release analysis of HMRC and ERC data).
UK taxpaying estates holding a home rose 35% between 2019 to 2020 and 2023 to 2024, while the average home in them rose 7.6% (HMRC).
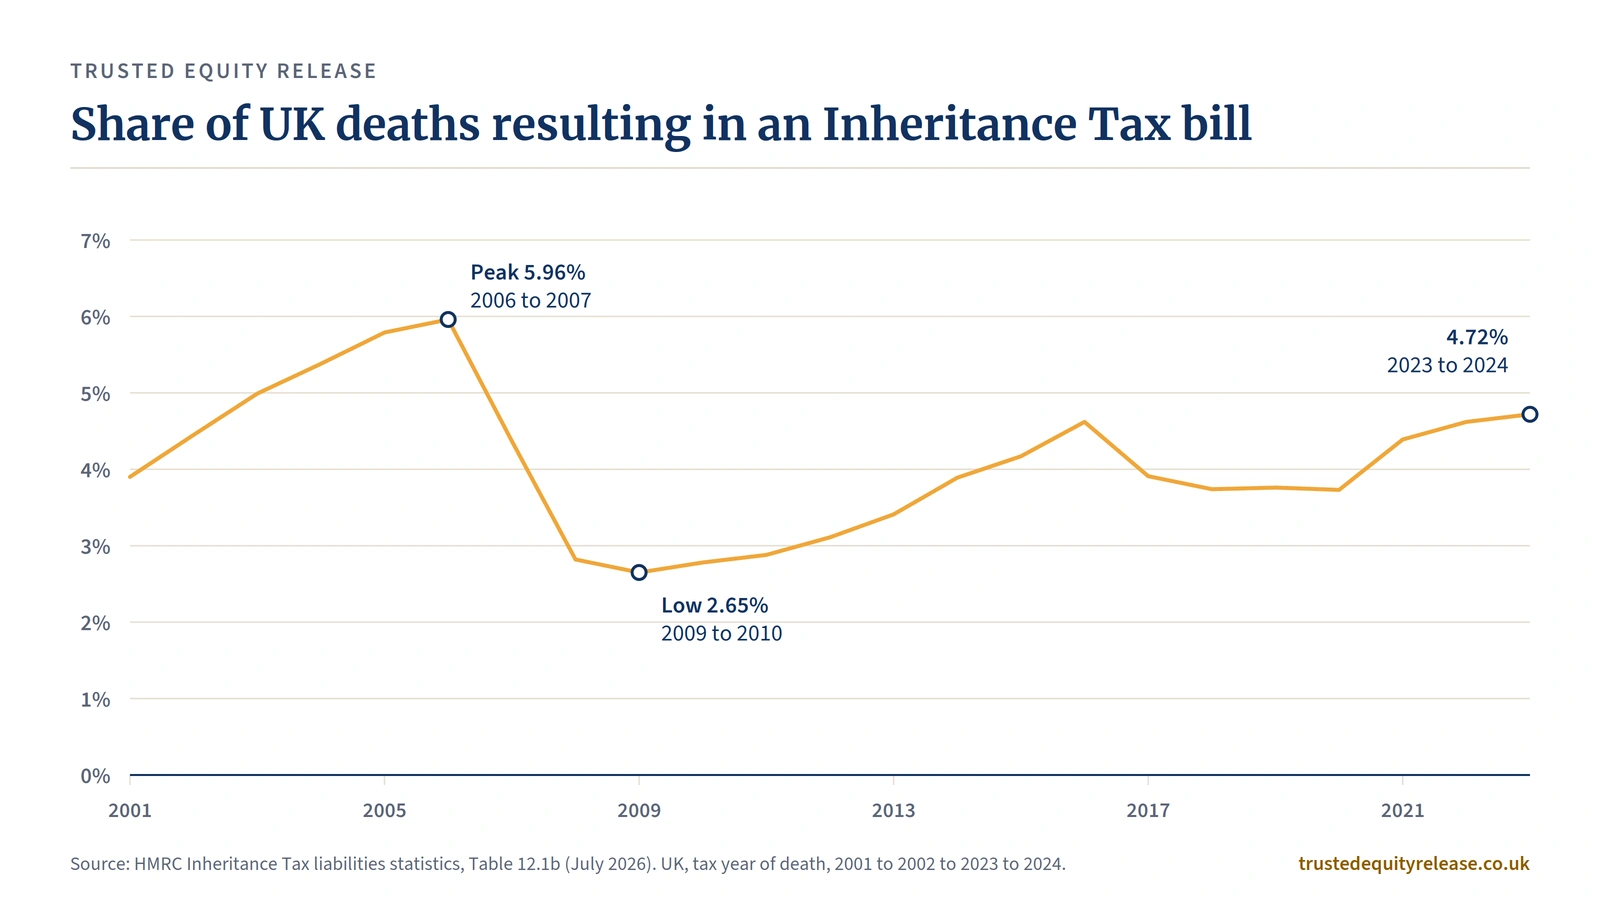
4.72% of UK deaths in 2023 to 2024 led to an Inheritance Tax bill, the highest share since 2006 to 2007 (HMRC Table 12.1b).
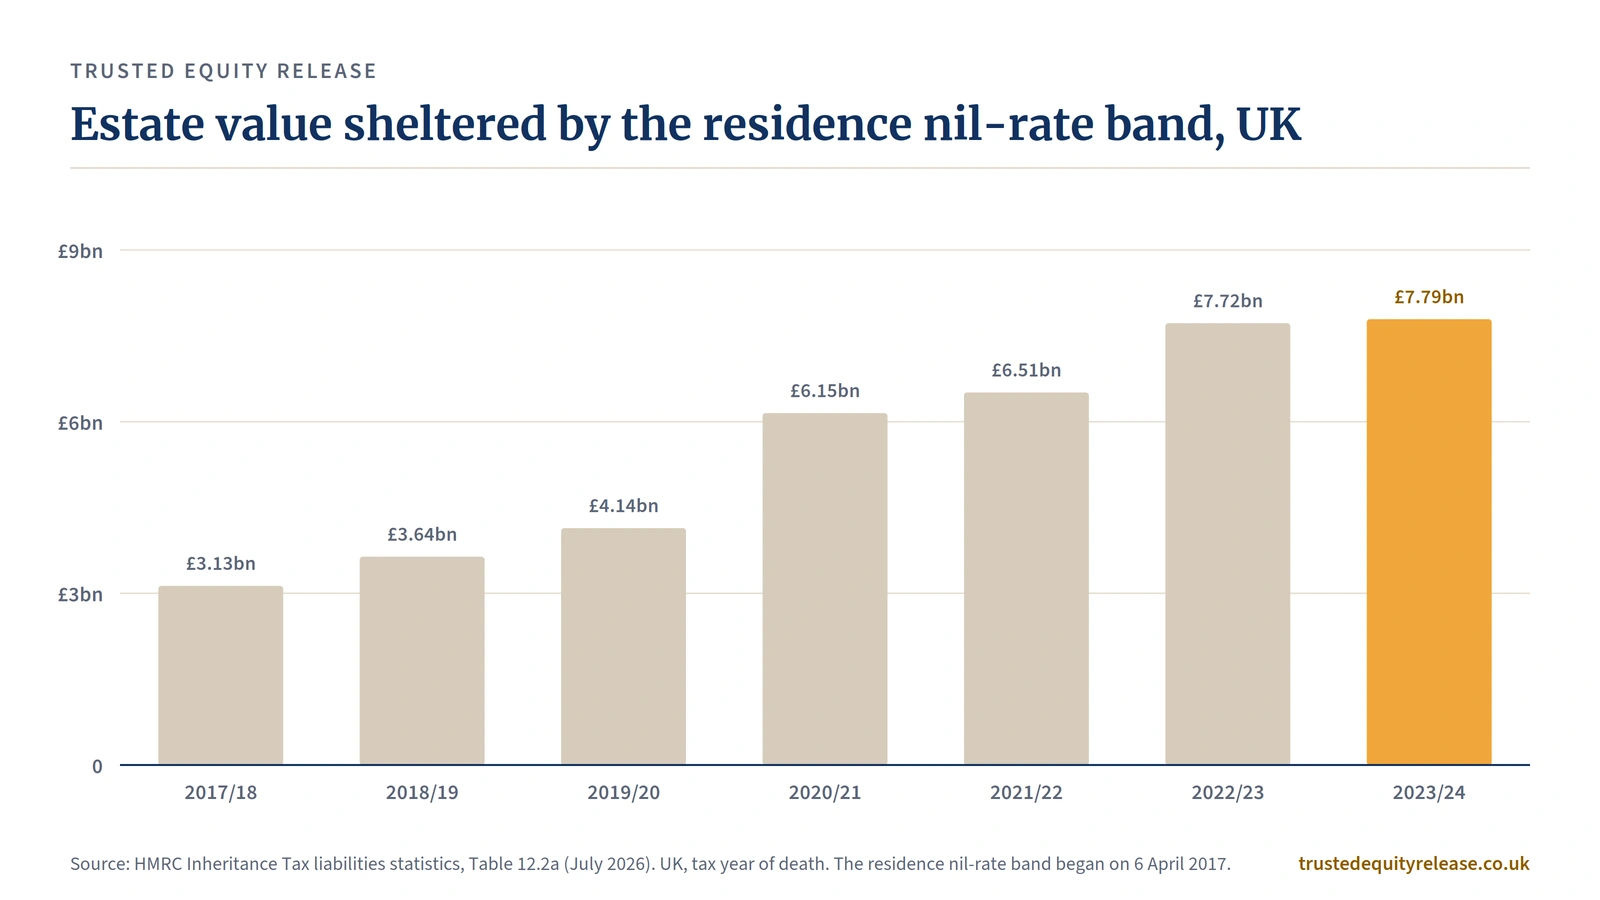
The residence nil-rate band sheltered £7.79bn of estate value on UK deaths in 2023 to 2024, up from £3.13bn in 2017 to 2018 (HMRC Table 12.2a).
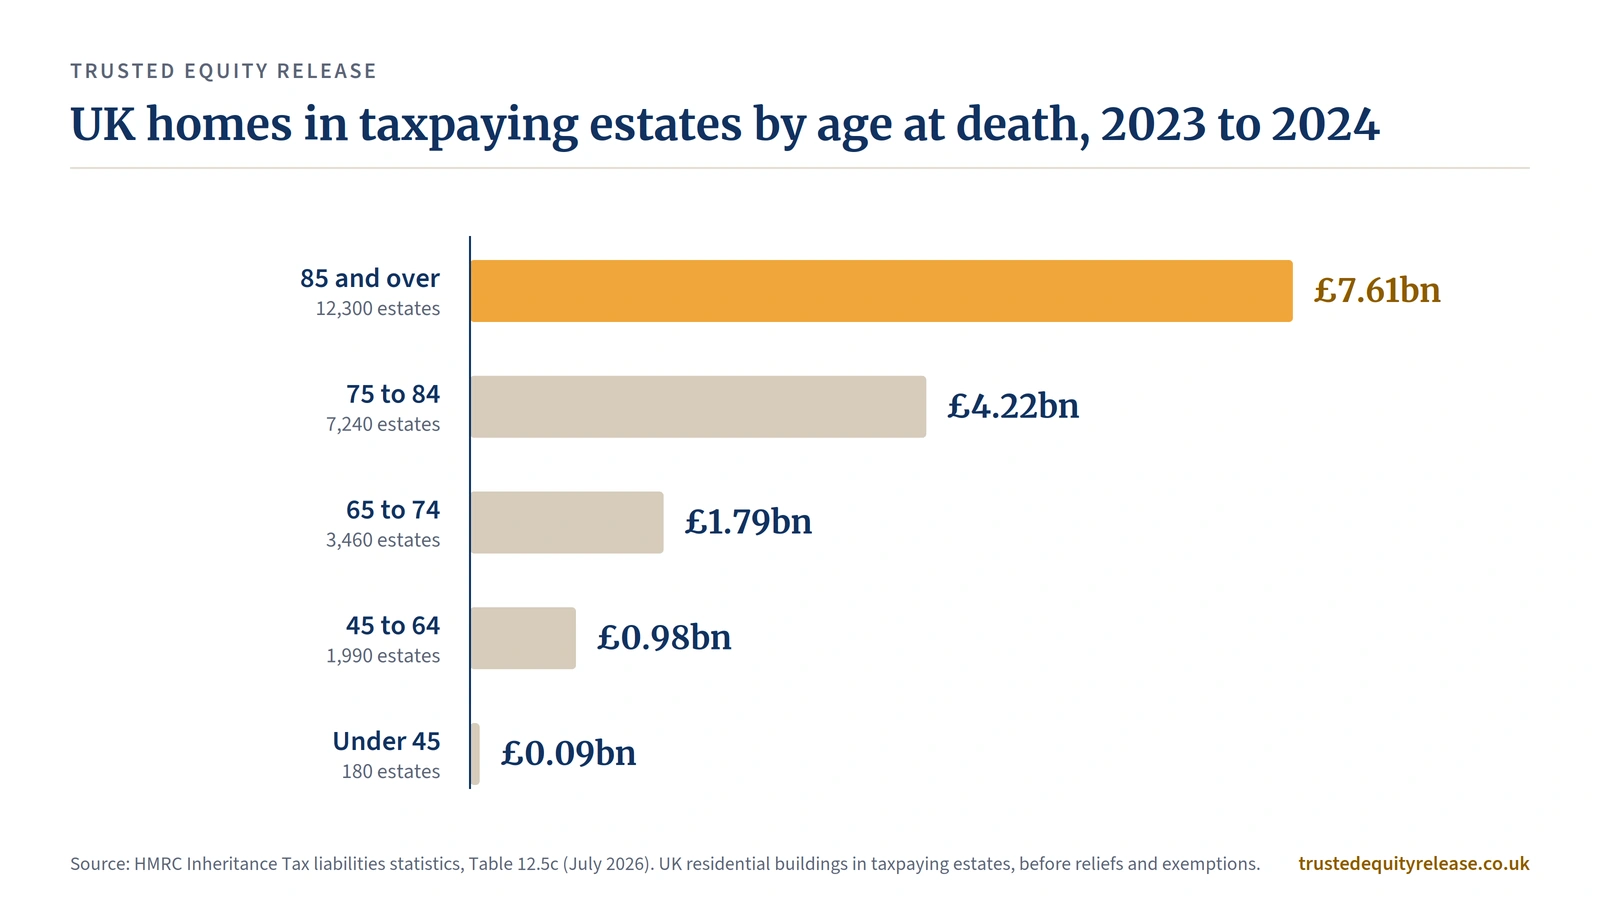
People aged 85 and over left 52% of the UK homes in taxpaying estates in 2023 to 2024, £7.61bn (HMRC Table 12.5c).
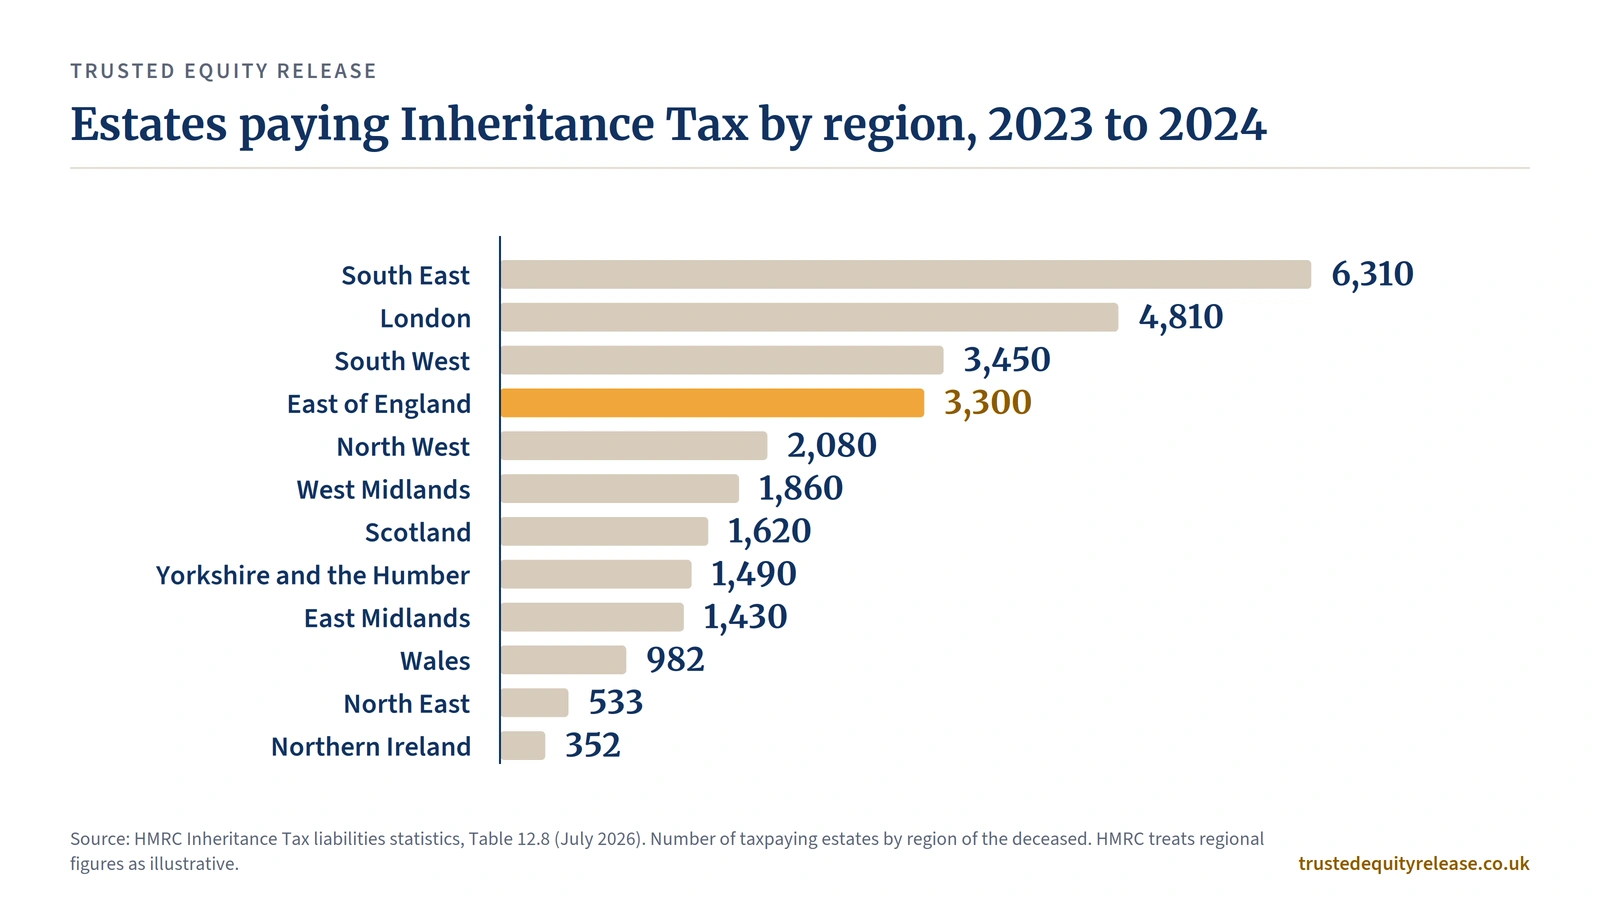
The East of England had 3,300 estates paying Inheritance Tax on deaths in 2023 to 2024, the fourth highest UK region (HMRC Table 12.8).
What each statistics page covers
This page is one of a series of four; the hub is UK equity release statistics. All four use the same rules: counted data only, geography and period on every figure, no estimates of what anyone could borrow.
UK equity release statistics
Annual lending 2016 to 2025, who holds Britain's housing wealth, and the Locked-Up Ratio.
02£1.83tnof homes owned by over-65s, England and WalesOver-65s housing wealth
The value of homes owned by households headed by someone 65 or over, for every local authority, 2011 to 2025.
03455,778over-65 households still paying a mortgageRetirement mortgage debt
Older households with a mortgage at the 2021 Census, by region, plus the UK interest-only maturity profile.
06This page£14.7bnof homes passed through taxed estates, 2023 to 2024Inheritance Tax and property
HMRC data on the homes in estates that paid Inheritance Tax, set against equity release lending.
How much property passes through estates that pay Inheritance Tax?
Estates that paid Inheritance Tax on deaths in the 2023 to 2024 tax year held £14.7bn of UK residential property, 35.9% of their £40.9bn gross value (UK, HMRC Table 12.5c). Homes were the largest single asset type, ahead of stocks and shares. Of the 30,400 taxpaying estates, 25,300 (83%) included a UK home. Values are recorded before reliefs and exemptions, so they describe what the estates held, not what was taxed.
| Asset type | Value in taxpaying estates (£bn) | Share of gross value |
|---|---|---|
| UK residential buildings | 14.70 | 35.9% |
| Securities (stocks and shares) | 11.80 | 28.9% |
| Cash | 7.21 | 17.6% |
| Loans and other assets | 3.24 | 7.9% |
| Other buildings and land | 3.07 | 7.5% |
| Insurance policies | 0.86 | 2.1% |
| Total gross capital | 40.90 | 100% |
Across every estate that sent HMRC a full account, taxpaying or not, UK homes were worth £28.7bn, 42.2% of £68.0bn gross (HMRC Table 12.3a). The other £14.0bn of housing sat in estates that reported to HMRC but owed nothing.
Frozen thresholds, not house prices, drove the rise
Housing in taxpaying estates rose 45.5% between 2019 to 2020 and 2023 to 2024, from £10.1bn to £14.7bn (UK, HMRC Tables 12.6c and 12.5c), and most of that came from more estates paying, not from dearer homes. The number of taxpaying estates holding a UK home rose 35.3%, from 18,700 to 25,300. The average home value in those estates rose only 7.6%, from about £540,000 to £581,000. Over the same period the nil-rate band stayed at £325,000 and the residence nil-rate band at £175,000.
| Taxpaying estates, UK | 2019 to 2020 | 2023 to 2024 | Change |
|---|---|---|---|
| Taxpaying estates | 23,000 | 30,400 | +32.2% |
| Of which holding a UK home | 18,700 | 25,300 | +35.3% |
| UK homes held (£bn) | 10.1 | 14.7 | +45.5% |
| Average home value per holding estate | £540,000 | £581,000 | +7.6% |
| Homes held by those aged 85+ (£bn) | 5.22 | 7.61 | +45.8% |
| Homes as share of gross estate value | 35.4% | 35.9% | +0.5 pts |
How many UK deaths lead to an Inheritance Tax bill?
4.72% of UK deaths in the 2023 to 2024 tax year led to an Inheritance Tax bill: 30,400 estates out of 644,000 deaths (HMRC Table 12.1b). That is the highest share since 5.96% in 2006 to 2007. The share fell to a low of 2.65% in 2009 to 2010, after the transferable nil-rate band arrived in October 2007, and has climbed for most of the period since. The 2023 to 2024 rise came partly from fewer deaths: UK deaths fell from 683,000 to 644,000 while taxpaying estates fell less, from 31,500 to 30,400.
The liability behind those estates reached £7.03bn, up 5% on the year, and the average bill rose 9% to £231,000 (HMRC). Cash receipts are a separate measure, counted when the money arrives: HMRC received £8.5bn of Inheritance Tax in the 2025 to 2026 tax year, against £3.5bn in 2006 to 2007 (HMRC receipts bulletin, September 2026).
The residence nil-rate band now shelters £7.79bn a year
Estates used the residence nil-rate band to shelter £7.79bn of value in the 2023 to 2024 tax year, up from £3.13bn when it began in 2017 to 2018 (UK, HMRC Table 12.2a). 31,000 estates above the nil-rate band claimed it in 2023 to 2024, more than the 30,400 that paid any tax, because some claims take an estate below the tax threshold altogether. The band itself rose in steps from £100,000 to £175,000 by April 2020, which explains much of the growth to 2020 to 2021. Growth since then reflects more estates claiming at a frozen rate.
Residence nil-rate band, as HMRC defines it in its statistics: "an additional tax-free threshold available to estates which transfer a main UK residence to direct descendants." The band starts to be withdrawn once an estate reaches £2 million.
Who leaves the most property?
People who died aged 85 and over left £7.61bn of UK homes in taxpaying estates in 2023 to 2024, 52% of the total (UK, HMRC Table 12.5c). Those aged 75 to 84 left a further £4.22bn. Homes make up a smaller share of the oldest estates, 33.2% at 85 and over against 40.9% at 65 to 74, because estates at older ages hold more in securities and cash.
Where do taxpaying estates cluster?
The South East and London accounted for 11,120 of the UK's 30,400 taxpaying estates in 2023 to 2024, and £3.26bn of the £7.03bn tax due (HMRC Table 12.8). The East of England had 3,300 taxpaying estates, the fourth highest of any region, with £639m of tax due and an average bill of about £194,000. London had the highest average at about £297,000. HMRC calls the regional split illustrative, because Inheritance Tax in 2023 to 2024 was still based on the domicile of the person who died.
Property Passed vs Released: £5.80 on death for every £1 released in life
For every £1 of housing wealth released through equity release in the 2023 to 2024 tax year, £5.80 of UK homes passed through estates that paid Inheritance Tax, up from £2.59 in 2019 to 2020 (Trusted Equity Release analysis of HMRC and Equity Release Council data). The ratio more than doubled because the two flows moved in opposite directions. Housing in taxpaying estates rose 45.5%, while equity release lending, aligned to the same tax years, fell 35.1%, from £3.90bn to £2.53bn.
| Tax year of death | Homes in taxpaying estates | Equity release lending, aligned | £ passed per £1 released |
|---|---|---|---|
| 2019 to 2020 | £10.1bn | £3.90bn | £2.59 |
| 2023 to 2024 | £14.7bn | £2.53bn | £5.80 |
How Property Passed vs Released is calculated
Sources. HMRC Inheritance Tax statistics, Table 12.6c (deaths in 2019 to 2020, July 2022) and Inheritance Tax liabilities statistics, Table 12.5c (deaths in 2023 to 2024, July 2026): row "Amount of UK residential buildings (£ million)", all ages. Equity Release Council full-year lending for 2019, 2020, 2023 and 2024 (UK).
Step 1. Take UK residential buildings in taxpaying estates for each tax year of death: £10,100m and £14,700m.
Step 2. Align Equity Release Council calendar-year lending to HMRC's tax year of death (6 April to 5 April). 270 of the 366 days in each tax year fall in its first calendar year, so aligned lending is 0.738 of year one plus 0.262 of year two: £3,904m for 2019 to 2020 and £2,534m for 2023 to 2024.
Step 3. Divide step 1 by step 2: £2.59 and £5.80 per £1 released.
Assumptions. Both figures are gross flows of UK housing value. HMRC values are before reliefs and exemptions and before mortgages, which HMRC records separately. ERC lending includes new plans, drawdowns from existing reserves and further advances. Lending counts are within a year; estate values are a stock passing at death. The ratio compares the size of two flows. It is not a comparison of options and says nothing about any individual household or estate.
Coverage. UK. Two tax years of death, either side of the 1 January 2022 excepted estates change. Taxpaying estates must still report, so the taxpaying series is unaffected by that change. Tables for 2020 to 2021 to 2022 to 2023 are held on the National Archives and will be added at the next refresh.
A floor, not a total. Estates that owed no tax are excluded. Adding every estate that sent HMRC a full account gives £28.7bn of homes in 2023 to 2024, £11.33 per £1 released. That wider figure still misses the excepted estates that no longer report at all, so no official figure exists for all housing passing on death.
Validation. Homes made up 51.6% of all estates that reported in 2019 to 2020 (HMRC Table 12.4a), consistent with the Institute for Fiscal Studies' reading of 2020 to 2021 data that residential property was more than half of reported estate value. The taxpaying estate count in Table 12.5c (30,400) matches HMRC's headline in Table 12.1a.
Reuse. Free to reuse with a link to this page. The data behind every figure is in the downloads below.
What changed in 2022, and why it matters for the numbers
From 1 January 2022, estates classed as excepted no longer report their values to HMRC, so HMRC's figures for non-taxpaying estates fell sharply and cannot be compared with earlier years (HMRC). Estates that sent HMRC a full account held £50.2bn of UK homes in 2019 to 2020 (204,000 estates) but £28.7bn in 2023 to 2024 (56,700 estates). That fall reflects reporting, not a collapse in the housing passing on death. HMRC now records 89.4% of UK deaths as not reporting to it, against 53.9% in 2019 to 2020.
Thresholds and the changes ahead
The nil-rate band is £325,000 and the residence nil-rate band £175,000, both fixed to the end of the 2030 to 2031 tax year (HMRC). The nil-rate band has not changed since 6 April 2009. HMRC's policy paper on thresholds says the measure "fixes the IHT thresholds at their current levels for one further tax year in 2030 to 2031."
| Threshold | Level | In place since |
|---|---|---|
| Nil-rate band | £325,000 | 6 April 2009 |
| Residence nil-rate band | £175,000 | 6 April 2020 |
| Residence nil-rate band taper starts | £2 million | 6 April 2017 |
Pensions from April 2027, in HMRC's words: "This measure will bring most unused pension funds and pension death benefits within the value of a person's estate for Inheritance Tax purposes from 6 April 2027." Death in service benefits from a registered pension scheme stay outside Inheritance Tax. Deaths from the 2027 to 2028 tax year will change the asset mix in HMRC's tables.
Source key
| Source | Tables used | Coverage | Next release |
|---|---|---|---|
| HMRC, Inheritance Tax liabilities statistics (July 2026) | 12.1a, 12.1b, 12.2a, 12.3a, 12.5c, 12.8 | UK, deaths in tax year 2023 to 2024 (12.1b from 2001 to 2002) | July 2027 |
| HMRC, Inheritance Tax statistics (July 2022) | 12.4a, 12.6c | UK, deaths in tax year 2019 to 2020 | Superseded |
| HMRC, tax receipts and NICs annual bulletin (September 2026) | Inheritance Tax receipts | UK, tax year received | Early 2027 |
| HMRC, Inheritance Tax thresholds and interest rates; thresholds policy paper (November 2025); unused pension funds policy paper (November 2025) | Thresholds, pension change | UK | On policy change |
| Equity Release Council, full-year market statistics | Annual lending 2019, 2020, 2023, 2024 | UK | Each January or February |
Cite this data
Every figure on this page is free to quote with a link back. Jeremy is available for comment on the numbers: jeremy@trustedequityrelease.co.uk.
Trusted Equity Release (2026). UK Inheritance and Housing Wealth Statistics 2026. https://www.trustedequityrelease.co.uk/guides/inheritance-housing-wealth-statistics/
<a href="https://www.trustedequityrelease.co.uk/guides/inheritance-housing-wealth-statistics/">UK Inheritance and Housing Wealth Statistics 2026</a>, Trusted Equity Release, 2026
Trusted Equity Release (2026) UK Inheritance and Housing Wealth Statistics 2026. Trusted Equity Release analysis based on HMRC Inheritance Tax statistics and Equity Release Council data. Available at: https://www.trustedequityrelease.co.uk/guides/inheritance-housing-wealth-statistics/ (Accessed: [date]).
Questions people ask about these figures
How much property passes through estates that pay Inheritance Tax?
What percentage of UK deaths pay Inheritance Tax?
How much Inheritance Tax is collected each year?
How many estates use the residence nil-rate band?
What is the average Inheritance Tax bill?
Which region has the most estates paying Inheritance Tax?
How does property passing on death compare with equity release?
When are new Inheritance Tax statistics published?

Trusted Equity Release is a trading name of Pellucid Ltd, authorised and regulated by the Financial Conduct Authority, FRN 981845. About Jeremy.